Win Rate Analysis by Deal Stage and Rep Segment
Separating win rates by stage and rep reveals hidden pipeline problems aggregated numbers conceal.

- Written by
- Sales Coach Picks Editors
- Updated
- October 14, 2026
- Reading time
- 11 min read
- Sources cited
- 7 sources ↓
What this covers
Win Rate Analysis by Deal Stage and Rep Segment.
A single company-wide win rate hides more than it reveals
Two reps, same quarter, same 40 opportunities apiece. One closes 12. The other closes three. Look at the pipeline reports and both territories seem to carry equal weight, equal volume, equal opportunity. The outcomes say something else entirely, and a single blended win rate for that team would smear the difference into a number nobody could act on.
That gap is a structural feature of the metric itself. It's the whole problem with reporting win rate as one figure. HubSpot's survey of over 1,000 reps puts the average B2B win rate at 21% across all opportunities, yet ask a room of sales leaders what theirs is and the answers cluster between 30% and 50%. That's a system quietly rewarding a comfortable number over an accurate one. It's what happens when nobody agrees on what goes in the denominator.
That last one deserves its own scrutiny. Deals that stall, that just go quiet without a yes or a no, make up an estimated 40% to 60% of enterprise pipeline. Strip those out of the denominator and the surviving number looks clean. It's clean the way a crime scene is clean after someone's mopped the floor.
The stakes here go beyond semantics. Across the industry, 79% of sales teams grew revenue over the past 12 months, and at the same time, up to 70% of individual reps missed quota in 2024. A single win rate figure is built to hide exactly that kind of split. The fix isn't a smarter formula bolted onto the old one. It's decomposing the number by stage and by rep segment, so the places where pipeline actually breaks stop hiding behind the average. Three measurement traps quietly inflate most leaders' numbers by 10–15 points: active-deal inclusion, denominator inconsistency, and no-decision exclusion, per Salesmotion's benchmarks guide.
Choosing a win rate formula before decomposing anything
Before slicing anything by stage or by rep, settle on what "win rate" means at the company, because there are at least five defensible ways to calculate it and they answer different questions. Basic win/loss (wins divided by wins plus losses) measures competitive effectiveness head-to-head. An all-opportunities denominator measures how efficiently the whole pipeline converts, no-decisions included. Win/loss ratio gives a fast read on competitive health. Period-based win rate tracks direction over time rather than a static snapshot.
The denominator argument appears concretely in the 21% figure everyone quotes. That 21% typically reflects every opportunity that ever entered the pipeline, while a commonly cited 29% reflects conversion from qualified opportunities only. Neither number is wrong. They're measuring different stretches of the same funnel, and reporting one without saying which is asking for confusion the moment someone compares it to a different team's number.
Deal value complicates this further. A team that closes three $500,000 deals out of ten looks, by raw count, worse than a team that closes seven $30,000 deals out of ten. Count-based win rate says the second team is winning more. Revenue tells the opposite story. Which one matters depends on whether the business cares about volume or about the dollars actually landing, and that's a judgment call that has to be made before the first report goes out, not argued about after two teams show up with different numbers.
Once a method is picked, the discipline is boring but non-negotiable: hold it. Switching formulas quarter to quarter turns every trend line into noise, because a jump from 24% to 31% might just be someone redefining the denominator, not a real gain. And check the CRM defaults before trusting anything. HubSpot and Salesforce each ship with their own assumptions about what counts as a closed opportunity, and pulling a segment report without confirming that setting first bakes the same inconsistency into every number below it.
Where pipeline leaks: stage-by-stage conversion rates
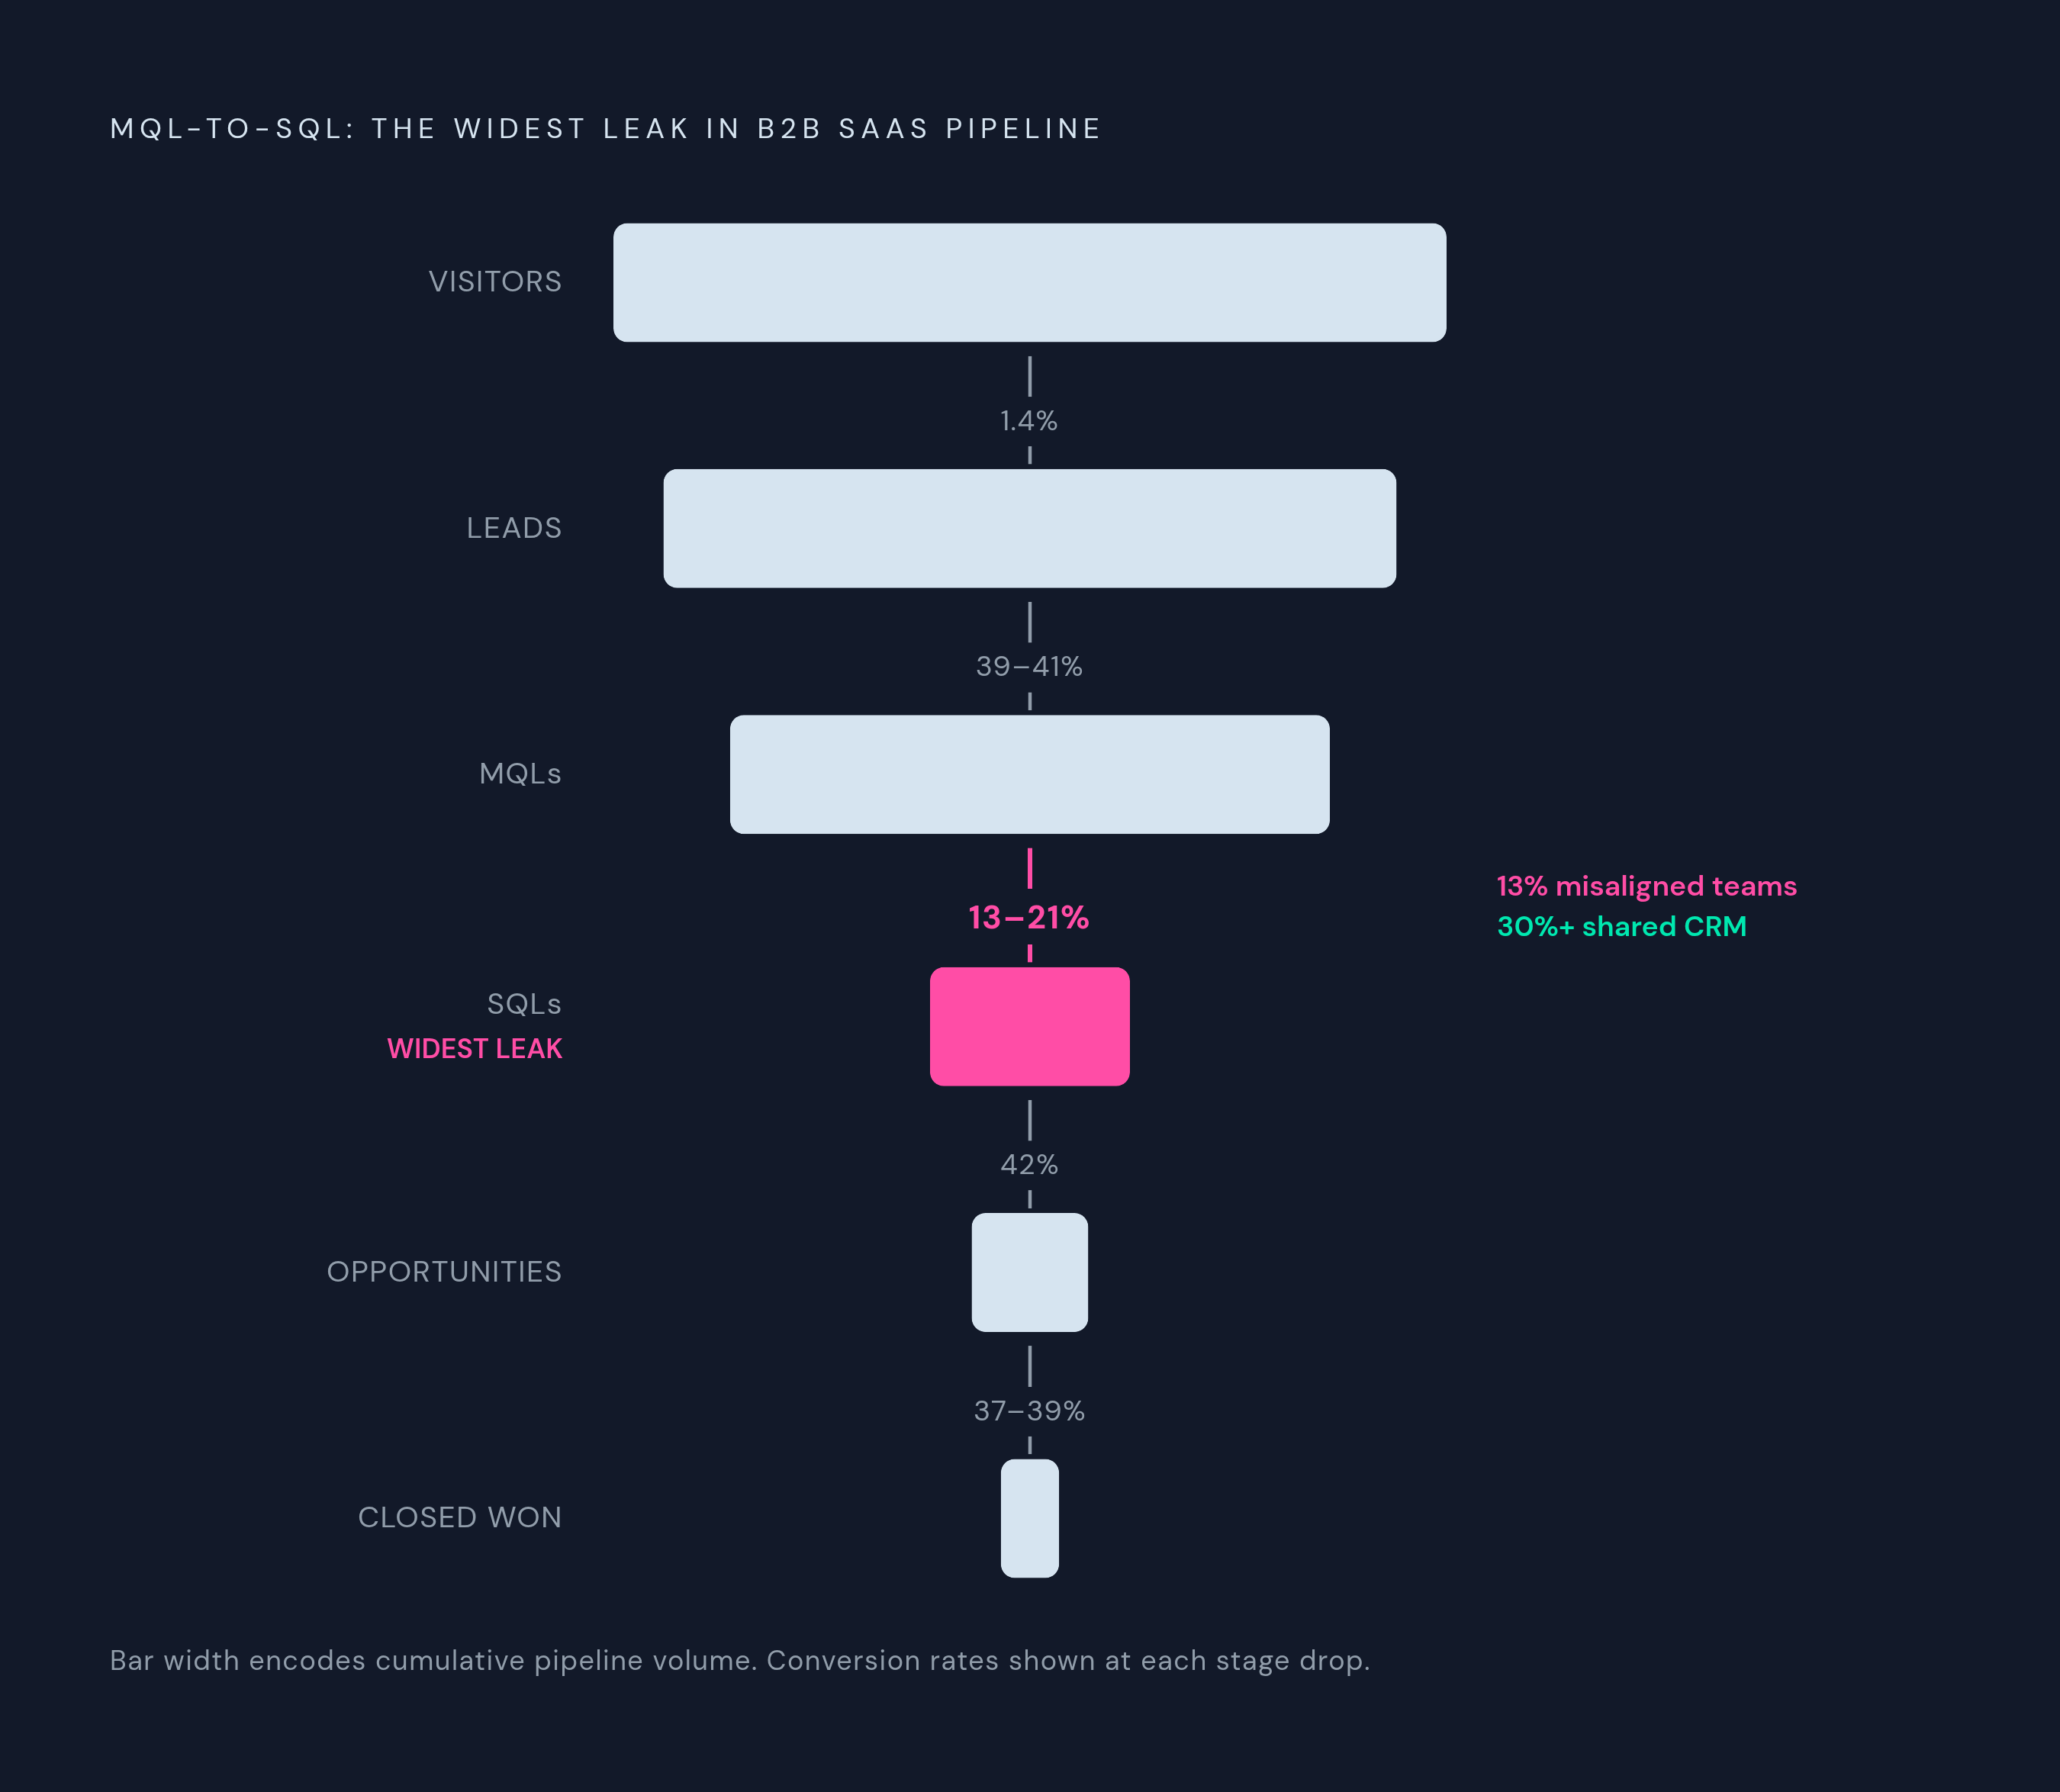
Once the formula is locked, the stage-by-stage view is where the real diagnosis starts. A reference funnel for B2B SaaS runs roughly: visitor-to-lead at 1.4%, lead-to-MQL at 39% to 41%, MQL-to-SQL at 13% to 21%, SQL-to-opportunity at 42%, and opportunity-to-close at 37% to 39%. Laid out that way, one stage stands out immediately as the widest leak in the entire system.
MQL-to-SQL is where most funnels bleed the most pipeline, with only 13% to 21% of marketing-qualified leads ever becoming sales-qualified. Teams with aligned lead definitions and shared CRM dashboards convert 30% or more at this stage, versus roughly 13% for teams where marketing and sales still work off separate criteria. Lead source widens that gap further.
Move past that bottleneck and the mid-funnel looks healthier. Roughly 50% to 60% of qualified first meetings advance into real pipeline opportunities, and the median qualified-to-booked-meeting rate is around 62%, with the top tier of teams hitting 78% or better. Demo-to-proposal conversion runs roughly 40% to 60%; when it drops below 35%, that's usually a sign the wrong prospects are getting into the demo in the first place, not that the demo itself is weak.
The costliest failure, though, occurs in timing rather than in any single stage boundary. When deals slip past two months in the late stage, win rates fall by 113%. Nothing else in the data comes close to that as a single point of damage.
What this stage-by-stage view gives a manager that one aggregate number cannot is direction. A team with a perfectly respectable close rate but a broken MQL-to-SQL handoff has a marketing-alignment problem, and no amount of sales coaching fixes it. The stage breakdown doesn't just describe where things go wrong. It tells someone exactly where to send the fix. Lead source creates dramatic divergence at the same MQL-to-SQL stage, with website leads converting at 31.3% versus 0.9% for email campaigns (a 35x gap from the same pipeline stage), per Digital Bloom.
Deal size and win rate expectations at every stage
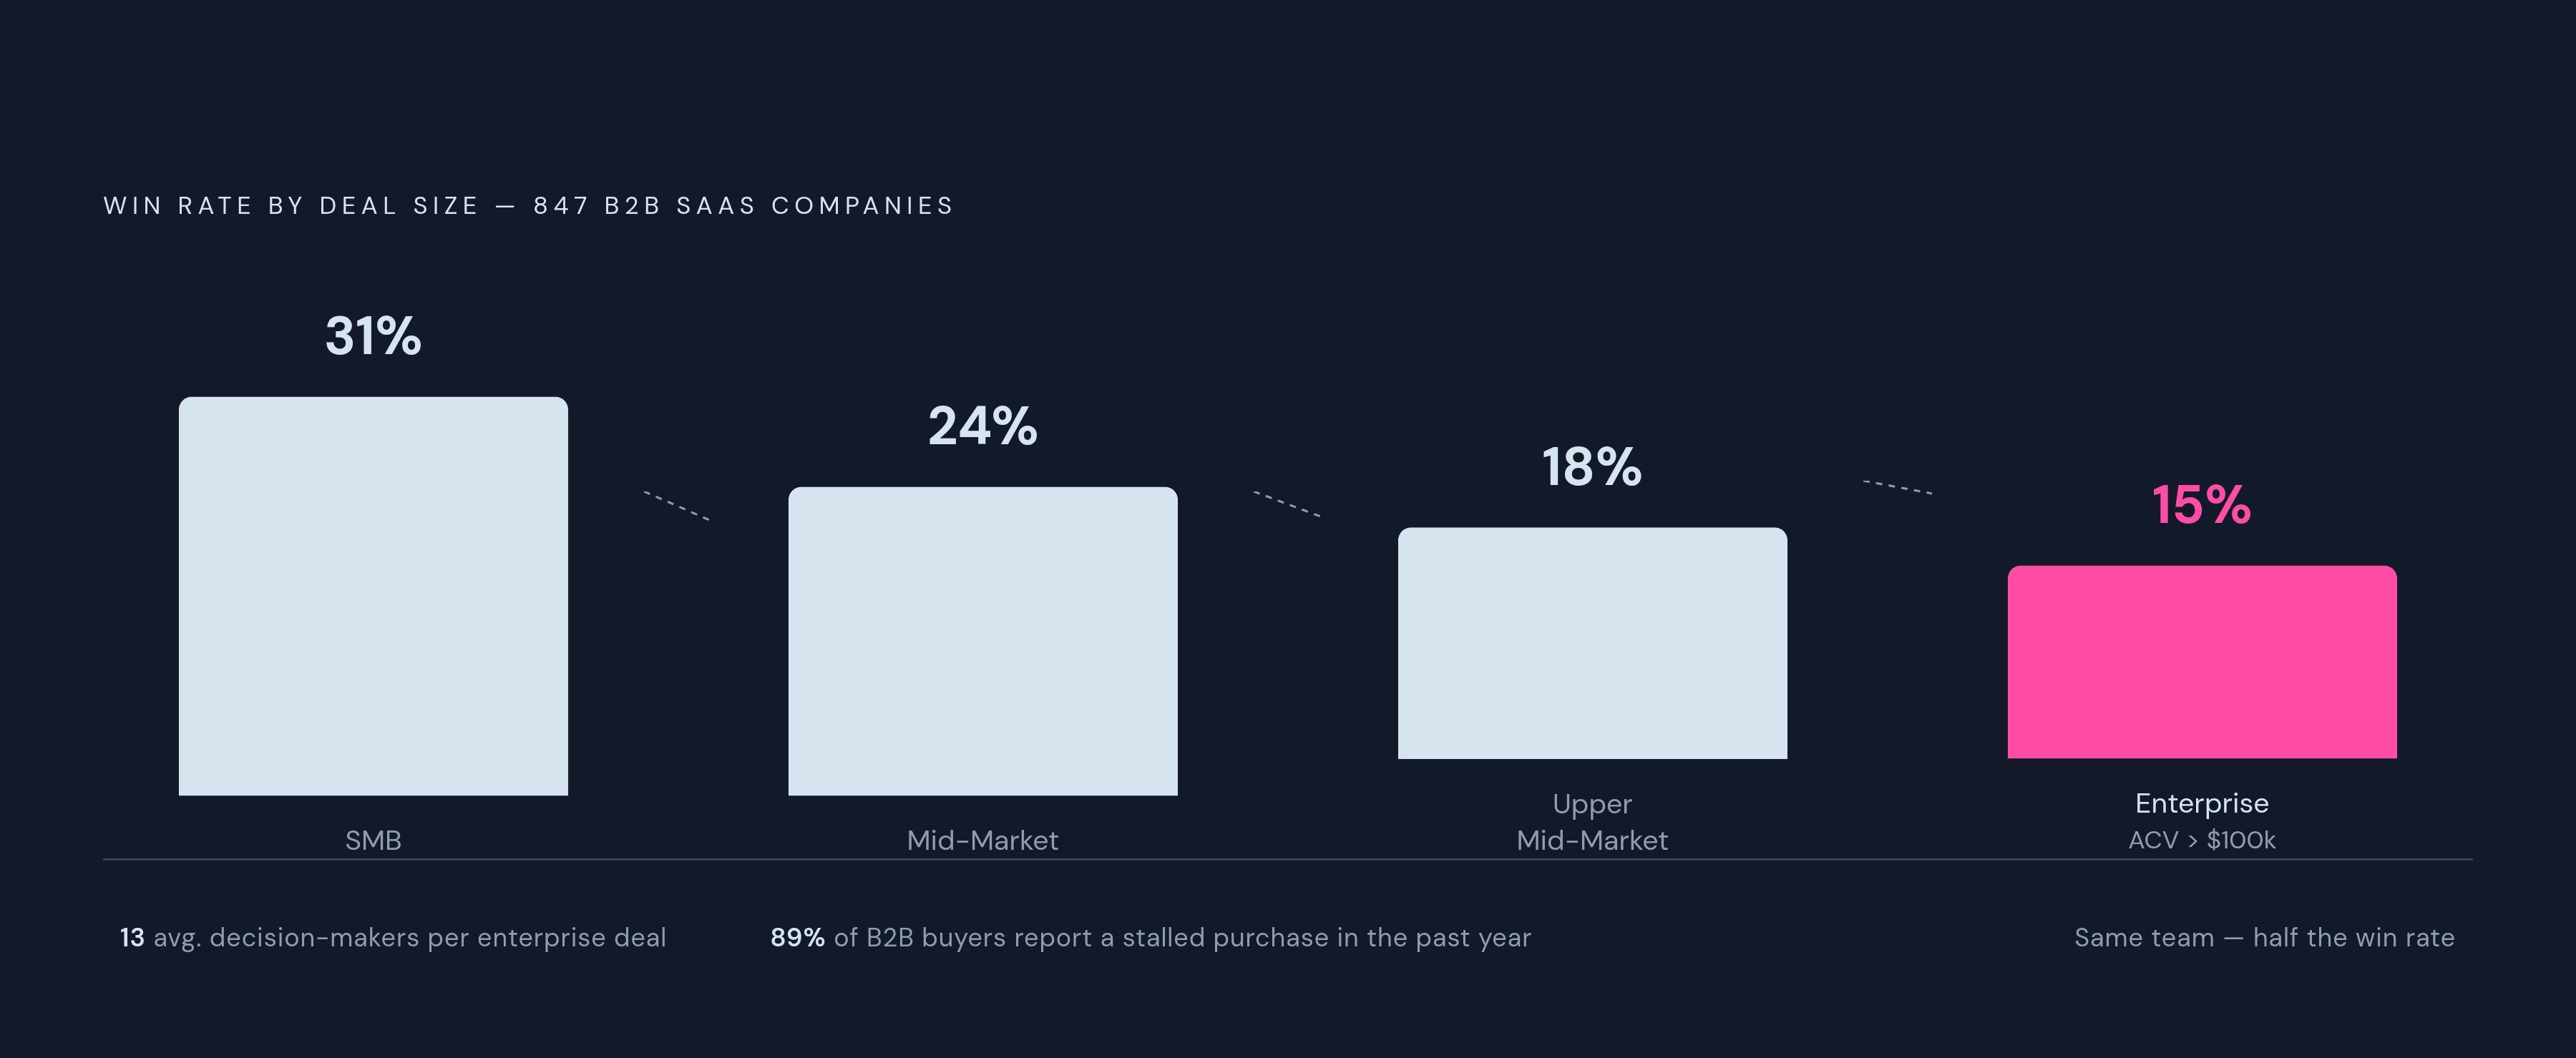
Layer deal size onto the stage data and a second, equally consistent pattern appears: win rate falls as deal size rises. One study of 847 B2B SaaS companies found SMB deals winning at 31%, mid-market at 24%, upper mid-market at 18%, and enterprise deals over $100,000 ACV converting at just 15%. That's not a fluke of one dataset. It appears everywhere sales teams break out win rate by deal size, and the reasons are structural rather than incidental.
Enterprise deals now involve an average of 13 decision-makers, longer procurement cycles, and sharper competitive pressure, and 89% of B2B buyers report that a purchase they were working on stalled at some point in the past year. More people in the room means more ways for a deal to stall, and every additional stakeholder is another chance for the deal to die quietly rather than close.
Even within a single stage, the expected range shifts depending on company maturity. Same funnel position, different expectations, because process maturity changes what "normal" looks like.
One case study makes the practical stakes plain. A B2B SaaS company found it was winning 45% of deals under $50,000 but only 15% of deals over $100,000. Surfacing that split, rather than reporting a single blended win rate, let the team build specific strategies for larger deals, and high-value win rate rose 20% within a single quarter. The split itself was the insight. Nobody found that by staring at one aggregate number.
The management implication follows directly: putting a rep who carries $20,000 ACV deals next to one who carries $200,000 ACV deals on the same win rate leaderboard isn't measuring performance, it's measuring deal size. Deal size bands have to be the first control variable, before anyone draws a conclusion about who's actually better at the job. Proposal-to-close variance by ARR band runs 20–30% at the $1M–$5M ARR range, while mature teams with documented processes at $10M–$30M ARR tend to see 25–40% (the same stage, very different expectations depending on where the company sits), per Domestique benchmarks.
Reading the rep-level win rate spread and knowing what it is telling you
With deal size controlled for, the rep-level spread starts to say something real. A top rep closing at 42% against a team average of 22% is a coaching opportunity sitting in plain sight. It's a coaching opportunity sitting in plain sight. Divide that by the team average to get a Performance Index, which normalizes for deal volume and makes the actual gap visible instead of buried in raw counts.
The broader context makes this urgent rather than academic. Across a dataset of 655,000 opportunities, 78% of sellers missed quota; RepVue's Cloud Sales Index put quota attainment at 42.69% in Q2 2025 and 43.24% in Q3. Missing quota is close to the norm now. It's close to the norm, which means the rep spread isn't a small tail of underperformers dragging down an otherwise fine team, it's most of the team.
Part of that gap is simply time on task. Average sellers spent fewer than two active-selling hours a day, while top performers averaged four. That's a scheduling and prioritization problem, not talent, and it's fixable through coaching in a way that raw aptitude isn't.
Stage data applied at the individual level turns generic coaching into something specific. A rep who moves deals from discovery to proposal just fine but loses consistently at negotiation needs a completely different conversation than one who can't get past initial qualification in the first place. Segmenting the team into rough tiers helps sharpen this further: top performers at 35% win rate or better, a core group at 20% to 30%, and a tail dragging the average down. The tail's break point is often identical across multiple reps, which means the problem is one shared failure wearing several names. It's one shared point in the process or the messaging that's broken for everyone standing on it.
Process, in fact, explains a good chunk of the spread on its own. Forrester's research found that companies with structured opportunity management processes achieve 43% higher win rates than those without. Some of what looks like a talent gap between reps is really a consistency gap between how rigorously each one follows the process.
Translating the stage-and-segment breakdown into specific interventions
Each leak calls for its own fix, and mismatching the fix to the leak wastes both time and goodwill. An MQL-to-SQL bottleneck needs marketing and sales sitting down together over shared lead definitions, a joint CRM dashboard, and an agreed ICP, not a sales training session.
A weak demo-to-proposal rate usually means qualification standards are too loose. One software company that tightened its standards initially lost about 30% of its opportunities outright, the ones that never should have made it to demo in the first place, but win rate rose substantially afterward and resources stopped being wasted on deals that were never going to close. Qualification, treated this way, functions as a revenue lever rather than just a filter that turns away marginal leads.
Late-stage slippage calls for a review cadence, not a pep talk. Given that a 113% drop in win rate follows once deals stretch past two months, weekly or biweekly pipeline reviews at the late stage aren't bureaucratic overhead, they're insurance against the single most expensive failure mode in the data.
Where the rep tail shares a break point, the fix is structural: inspect the playbook, the talk track, and the competitive response used at that exact stage, because the problem is embedded in the process. And where deal size and rep assignment don't match, that's a territory design problem. Routing enterprise opportunities to a rep whose track record was built entirely on SMB deals sets that rep up to look worse than they are, and RevOps needs to build territory plans around the deal-size win rate curve rather than around headcount convenience.
Deals that close within 50 days hit a 47% win rate, while deals dragging past that mark fall to 20% or lower. Compressing the sales cycle is a lever on win rate itself. It's a win rate intervention in its own right.
Forecastio's approach illustrates what closing this loop actually looks like in practice: pairing win rate with deal history, pipeline health, and rep performance data to build predictive forecasts inside HubSpot, flagging which deals are likely to stall before they do and giving each rep a specific roadmap rather than a generic scorecard. That's the difference between measurement that sits in a dashboard and measurement that changes what happens next.
Building a win rate review cadence that stays honest over time
Measuring win rate and understanding it are not the same exercise, and most organizations only do the first one. 82% of sales teams measure win rate, but only 23% actually understand what's driving their performance underneath it. A number without an explanation is just something to put in a slide deck.
Timing shifts rolling quarters' comparisons enough to change which trends a team sees. Rolling quarters almost always give a truer read than calendar-year comparisons because they smooth out seasonal spikes, an enterprise software team, for instance, might see Q4 win rates run well above the rest of the year purely from budget-flush timing, and a straight annual average would let that quarter quietly distort the whole trend line.
Cadence should differ by level, because each level answers a different question on a different clock. Team-level aggregate win rate deserves a monthly look, mainly to catch direction. Stage-level breakdowns are worth a quarterly review, since process drift becomes visible slowly. Rep-level Performance Index numbers need monthly attention, because coaching needs compound if they sit unaddressed for a full quarter.
None of this holds together without governance on the formula itself. Document which denominator the company uses, write it into the CRM configuration, and require a change-control step before anyone alters it. Skip that step and quarter-over-quarter comparisons become meaningless the moment two people on the same team start pulling numbers two different ways.
Tracked frequently enough, win rate becomes a leading signal instead of a lagging scoreboard. Checked weekly or biweekly, a downward drift mid-quarter gives a manager time to adjust coaching or messaging before the damage appears in booked revenue. Waiting for the quarterly number to confirm the problem means finding out after the deals are already lost.
Finally, treat industry benchmarks as reference points, not targets to chase blindly. A win rate above 40% can just as easily mean a team is under-qualifying and avoiding harder, larger deals as it can mean real strength, and a rate below 15% usually points to ICP misalignment or a broken process somewhere upstream. The purpose of breaking win rate down by stage and by rep was never to produce a prettier dashboard. It was to shorten the distance between spotting a problem and doing something about it.
Methodology & sources
- Sales Win Rate Calculator: 5 Tactics to Boost Conversion [2025]
Provided the case study of a B2B SaaS company winning 45% of deals under $50,000 but only 15% of deals over $100,000, and the resulting 20% improvement in high-value win rate.
- Sales Win Rate: How to Calculate and Benchmark in 2026 | Salesmotion
Cited for the three measurement traps that inflate win rates by 10–15 points and the example of a jump from 24% to 31% that may reflect denominator redefinition rather than real gains.
- Sales Win Rate: How to Define, Calculate, and Improve It According to the HubSpot Sales Team
Provided the average B2B win rate of 21% across all opportunities from a survey of over 1,000 reps.
- 2025 B2B Sales Performance Benchmark Report
Provided the statistics that 79% of sales teams grew revenue over the past 12 months while up to 70% of individual reps missed quota in 2024.
- 2025 B2B SaaS Funnel Benchmarks & Pipeline Audit Framework
Provided the B2B SaaS funnel benchmark rates including visitor-to-lead at 1.4%, lead-to-MQL at 39–41%, enterprise win rate of 15%, and the 35x lead source conversion gap between website and email campaigns.
- Win Rate Benchmarks by Industry, Deal Size, and Source in 2026 | Landbase
Provided the win rate breakdown by deal size segment showing upper mid-market deals converting at 18%.
- Sales Pipeline Velocity Statistics: Why Deals That Close in 50 Days Win Twice as Often
Provided the statistic that deals closing within 50 days hit a 47% win rate while deals past that mark fall to 20% or lower.