Pipeline Coverage Ratio Benchmarks by Sales Segment
Segment-specific win rates demand different coverage targets to keep forecasts honest.

- Written by
- Sales Coach Picks Editors
- Published
- October 2, 2026
- Reading time
- 9 min read
- Sources cited
- 8 sources ↓
What this covers
Pipeline coverage ratio compares qualified pipeline with quota, so the appropriate ratio changes with past conversion patterns in the segment. Since SMB, middle-market, and large-account teams convert opportunities differently, their math-driven benchmarks diverge, and a mismatched standard for any segment skews the forecast in a particular, foreseeable way.
Why the 3x rule exists
The 3x rule for pipeline coverage was never grounded in a study of what actually works. The math is simple: winning 33% of deals yields 3x, a number that lines up with what industry research firms and most public B2B software companies in the mid-market report as their long-run average. It caught on because B2B companies in the mid-market make up a big, well-documented slice of the software world, and because 3x trips off the tongue in the boardroom. Hidden inside the rule is the assumption that a team's real win rate is 33%, which is off for most sales motions, and off in different ways from one segment to the next. The rule falls short: a special case taken for a universal law.
Win rate across SMB, mid-market, and enterprise segments
Win rates don't scatter randomly by company size or deal type. They cluster in groups, and those groups point to recognizable differences in how deals are done. SMBs with sub-60-day sales cycles and deals below about $25,000 ACV close 25% to 40% of their qualified pipeline, whereas enterprise field sellers pursuing contracts worth more than $100,000 a year land only 12% to 18% in typical conditions, sometimes slipping toward the 12–15% range where competition runs hot. Mid-market outfits, those selling into organizations with headcounts from 100 up to 999, typically land 25% to 35% of deals, the precise rate varying by sector and approach. The same trend shows up at the company level as well. Companies bringing in $1M–$5M close about 26% of their deals, compared with just 17% for those above $500M.
These patterns are anything but accidental. Large accounts require approval from groups exceeding twelve stakeholders, drag on long enough for rivals to disrupt them midstream, and endure a level of examination absent from faster SMB deals. Another layer deepens this complexity: the origin of an opportunity reshapes its likelihood of success well in advance of any initial conversation. When product usage drives acquisition and reps merely assist, those opportunities close more often than cold outreach does, meaning identical ACV deals win or lose depending entirely on their source. Combining segment with motion shows that one blanket win rate across a full portfolio obscures more than it clarifies.
The segment-specific coverage benchmarks that win-rate math produces
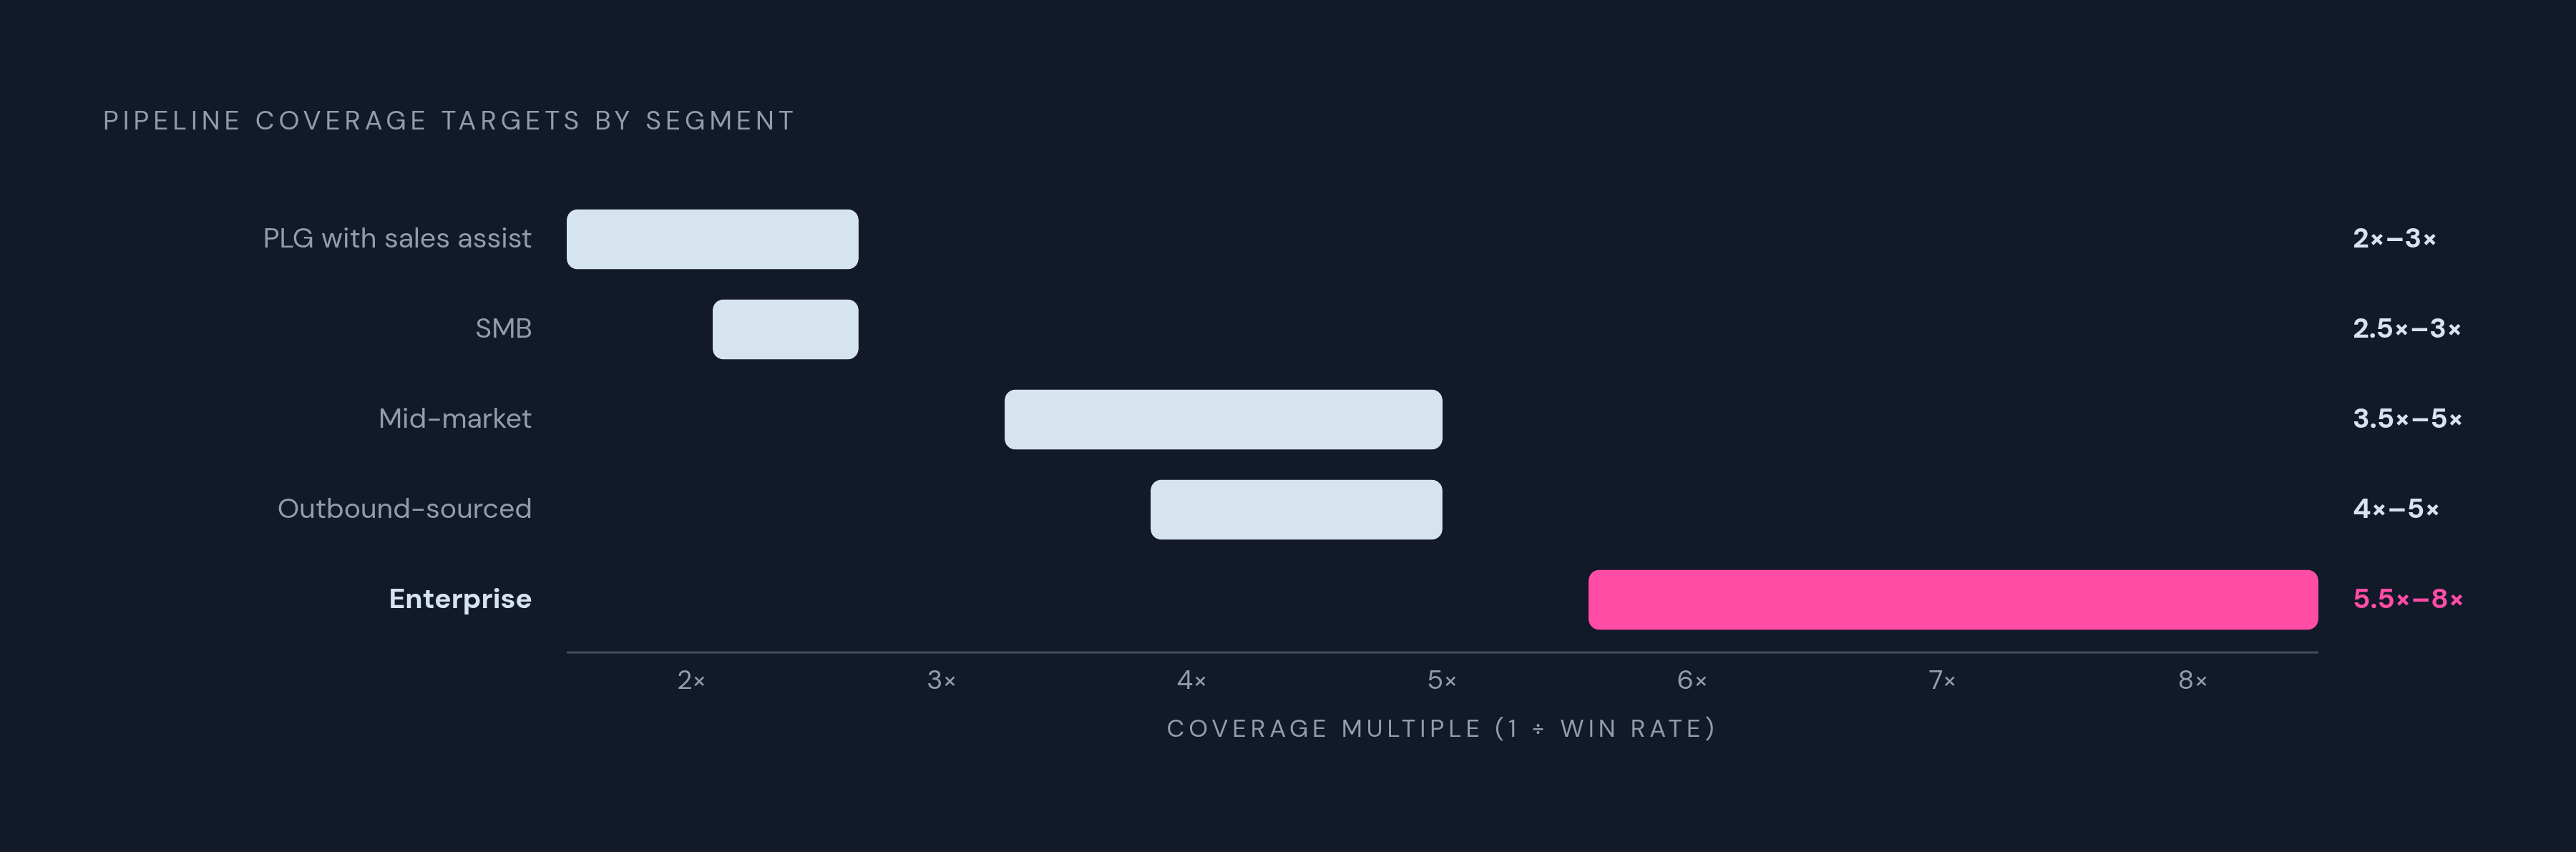
Once the coverage formula is run against each segment’s actual win-rate range, the targets spread so far apart that one company-wide average stops helping and starts distorting the forecast. The following table shows the resulting math for each segment and motion.
| Segment / motion | Typical win rate | Coverage target | Why | |---|---|---|---| | SMB (under ~$25K ACV, sub-60-day cycles) | 30–40% | 2.5x–3x | Short cycles and high win rates mean fewer dollars of pipeline cover each dollar of quota; the Optifai Sales Ops Benchmark, built from 939 B2B companies tracked between Q2 2025 and Q1 2026, places the SMB target in this 2.5x–3x band. | | Mid-market ($25K–$100K ACV, 60–90 day cycles) | 20–28% | 3.5x–5x | Lower conversion than SMB pushes the multiple up; Umbrex analysts recommend holding 3–4x of next-quarter coverage with at least 20% of that period's pipeline already in late stages by mid-quarter. | | Enterprise ($100K+ ACV, 90–180+ day cycles) | 12–18% | 5.5x–8x | Committee size, cycle length, and displacement risk drag win rates down, and when rates fall to the 12–15% end of that range, 6x or more becomes necessary just to stay on plan. | | Strategic / Named Accounts ($500K+ ACV) | Very low, multi-year cycles | 5x–8x | Extended, multi-year sales cycles and thin win rates on the largest deals require the same wide margin as core enterprise, sometimes wider. | | Product-led growth with sales assist | Higher | 2x–3x | Buyer self-selection before a rep ever engages lifts conversion odds, so less pipeline is needed to reach the same quota. | | Outbound-sourced pipeline | Lower | 4x–5x | Cold-sourced pipeline converts at a lower rate than PLG-assisted or inbound pipeline, so the same quota needs more coverage behind it. | | Channel / partner | Depends on partner maturity | 3x–5x | The range depends on how mature the partner relationship is and how accurate deal registration tends to be. | | New territory or new product | Unproven | 5x–7x | With no track record to divide into, a wide margin of safety stands in for data until enough deals have closed to calculate a real rate. |
Every row comes from running one formula over a different denominator each time. None of them was picked as a convenient round figure. Each is the result of inverting a win rate that was genuinely observed in a genuine segment.
What the wrong benchmark does to a forecast
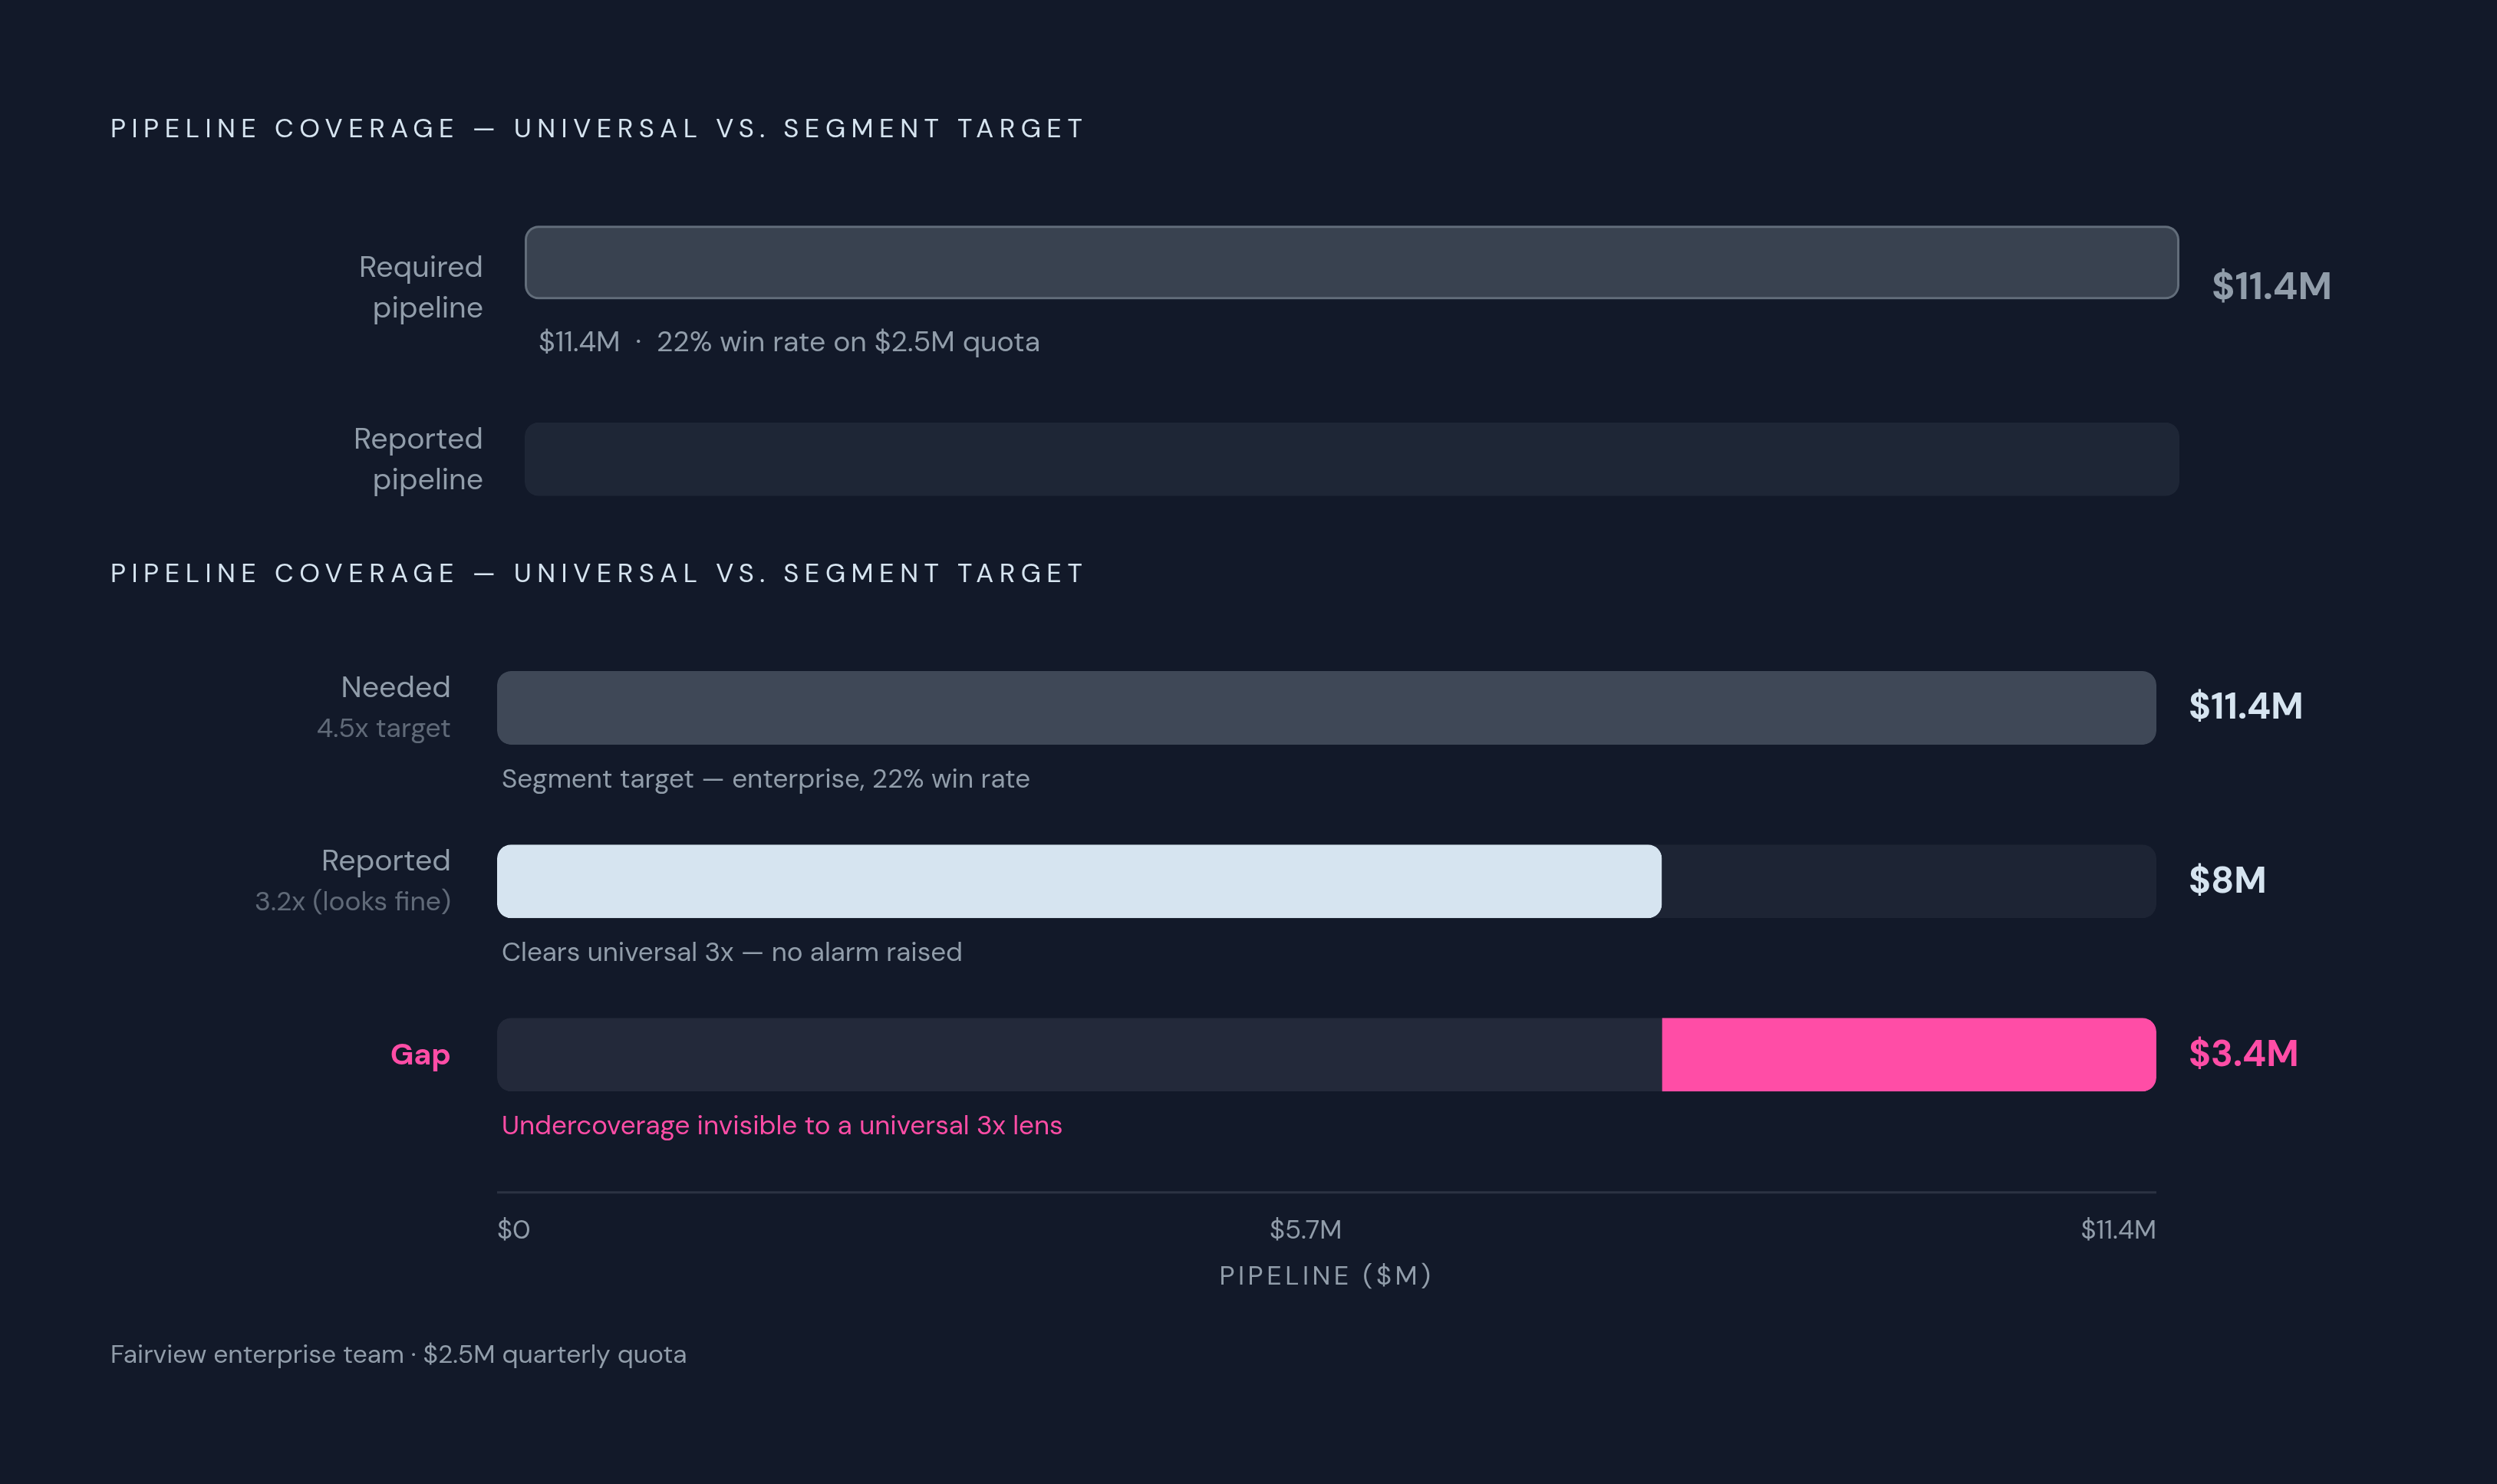
A universal 3x target applied to an enterprise team produces a forecast that looks fine right up until the quarter it fails, because the shortfall it hides is invisible until there is no time left to close it. In Fairview's worked example, an enterprise field-sales team with a $2.5M quarterly quota and a 22% win rate needs $11.4M in pipeline. If that team reports $8M in pipeline, unweighted coverage reads 3.2x, above the universal target. Measured against the correct segment target of roughly 4.5x, the same team is undercovered by $3.4M, a gap a universal-target eye never catches.
At SMB, the mistake works the other way. When a team wins 45% of opportunities yet carries 4x coverage, it is working with about double the pipeline required, which should read not as comfort but as a warning: standards for qualification may have weakened, or reps may be pursuing deals that ought to be ruled out sooner. Treat more than 5x coverage warily in any segment, because such an overfilled pipeline is often packed with stale deals for audit, not a real, bankable surplus. Weighted pipeline adds another test by applying close odds to every deal amount: aim for weighted coverage at 0.8x to 1.2x against target, as sub-0.8x suggests execution or qualification gaps while over-1.2x often signals unlikely deals have been loaded into the forecast.
How stale CRM data inflates coverage
Even a well-built segment target can mislead if the pipeline inputs are dirty, especially when dead opportunities linger and stages are overstated so coverage looks stronger than it is. The routine version looks fine at first: 4x coverage appears on the dashboard, sales leadership keeps the meeting moving, but closer scrutiny reveals two big opportunities untouched for six weeks, three stale prior-quarter close dates, plus one rep absent from CRM for a month. Remove them, and coverage lands nearer 2x.
That gap often begins with close-date drift. Rather than mark it Closed Lost, reps keep moving the expected close to later weeks, leaving the opportunity on the pipeline report with no realistic path to close. Stage inflation happens at the same time. If stage advancement is not tied to specific proof points, reps can overstate where opportunities stand, making a Proposal deal with no recorded decision schedule or agreed next action appear sound despite the warning signs.
A straightforward audit rule addresses both problems: strip out any deal with no activity in 45 to 60 days before calculating coverage. A reported 4x number that is really a third dead deals works out to roughly 2.8x, and that gap separates hitting the number from missing the quarter. Three errors account for most of the inflation that audit catches: counting marketing-qualified leads as if they were pipeline, counting pipeline that has no realistic chance of closing within the period, and calculating coverage off a win rate that is higher than the team's actual historical performance. Each of the three turns a coverage number into theater rather than a forecast.
Coverage targets through the quarter and across roles
Early in a quarter, having 3x to 4x coverage across every pipeline stage signals health. Halfway through, attention turns to deals at the proposal or negotiation phase, which must reach 1.5x up to 2x the remaining target. A group sitting on abundant initial opportunities by week six yet lacking mature deals is falling behind, regardless of whether combined metrics appear healthy.
Who is selling counts for just as much as when they sell. A seasoned seller with a proven track record of closing deals can manage with a leaner pipeline than a recent hire, so forcing all reps to meet the same team-wide multiple hides precisely those most likely to fall short of their targets. The importance of this metric extends beyond the sales team too. Investors treat coverage as an external gauge of a team's ability to reach its target: when the ratio falls below 1x of quota, hitting the period becomes impossible absent an unexpected surge in win rates, a reality weighty enough to drive board-level discussions concerning staffing, budget allocation, and future projections. Internally, coverage a quarter or two ahead matters just as much, because spotting it soon reveals an approaching revenue gap in time to start outbound campaigns or rethink the ideal customer profile, instead of finding the shortfall once it can no longer be fixed.
Where the benchmarks are contested
Experts clash most fiercely about the conservatism of published multiples for enterprise and mid-market deals, not about tailoring coverage by segment. Another critique examines the figure's origins: since that 3x standard reflects a bygone period of corporate sales, it steers most current groups wrong, leaving 1 divided by past win rate plus a cushion matching each squad's slippage as the sole justifiable multiplier, lacking any absolute minimum.
Neither objection weakens the case for segment-level targeting. Both reinforce it, by demonstrating that even a carefully built segment table marks a beginning rather than an end. Ven.studio's enterprise estimate and the long-standing critique of 3x converge on one practical move: test any published benchmark against the past four quarters of deals a team has actually closed and won, then adjust. Analysts' conflicting views themselves show that no one table, even the one presented above, merits treatment as the last word. The one coverage target that actually carries authority is 1 divided by the win rate a team has posted lately, calculated for every segment on its own terms.
Setting and maintaining a segment-calibrated coverage target
To create a reliable coverage target, follow the steps in sequence and revisit them on a set cadence. Pull results for wins and losses from the past four quarters, then calculate each segment’s actual win rate on its own rather than blending all accounts into one total, because a companywide average hides the differences this argument depends on. After segment rates are ready, use the article’s formula, dividing 1 by win rate, to create distinct targets for SMB, midmarket, enterprise, plus any named-account group or new territory bucket in play, instead of relying on a benchmark report figure shaped by another company’s deal mix. Next, enforce CRM cleanup rules: remove opportunities once 45 to 60 days pass without activity, make reps add the next action and timing before anything stays in Proposal or beyond, and mark stalled opportunities Closed Lost instead of allowing endless close-date slips. Finally, make the review part of the ongoing rhythm. As market conditions, selling motions, and team makeup evolve, revisit the segment math and its coverage target each quarter using the team’s current data, not an old benchmark report.
Methodology & sources
- IT Services Firm GTM Benchmarks 2026: Pipeline Coverage Ratio, Win Rate by Vertical, and Sales Capacity Utilization
Provided mid-market headcount definitions, win rate by company revenue band, and the 45-to-60-day activity audit rule.
- Sales Pipeline Coverage - Definition & B2B Examples
Cited for the practical benefit of spotting pipeline gaps early enough to launch outbound campaigns.
- Sales Pipeline Coverage Ratio: Formula, Benchmarks, and Fixes
Supplied the enterprise win-rate floor of 12–15%, the stale-pipeline audit scenario showing coverage drop from 4x to 2x, and the close-date drift and stage inflation mechanics.
- Pipeline Coverage Ratio: Targets and How to Improve — Fairview
Provided the worked example of an enterprise team with a $2.5M quota and 22% win rate showing how 3x masks a $3.4M shortfall, and the weighted coverage 0.8x–1.2x guidance.
- Pipeline Coverage Ratio: Formula, Benchmarks & How to Hit Your Number
Supported the point that opportunity source reshapes win likelihood and noted the CRM hygiene detail of a rep absent from CRM for a month.
- How do you calculate sales pipeline coverage ratio? - Optifai Data & Insights
Cited as the basis for the SMB 2.5x–3x coverage target from the Optifai Sales Ops Benchmark of 939 B2B companies.
- Pipeline Coverage Ratio
Provided the mid-market 3–4x recommendation with 20% late-stage requirement, the SMB over-coverage warning at 4x for a 45% win-rate team, and the close-date slip and coverage calculation guidance.
- Pipeline Coverage Ratio: How to Calculate It (And Fix It)
Provided the intra-quarter coverage guidance: 3x–4x early in the quarter and 1.5x–2x at the proposal/negotiation stage by mid-quarter.