Sales Activity Metrics That Actually Predict Revenue
Stage-conversion rates reveal revenue problems sixty to ninety days early.

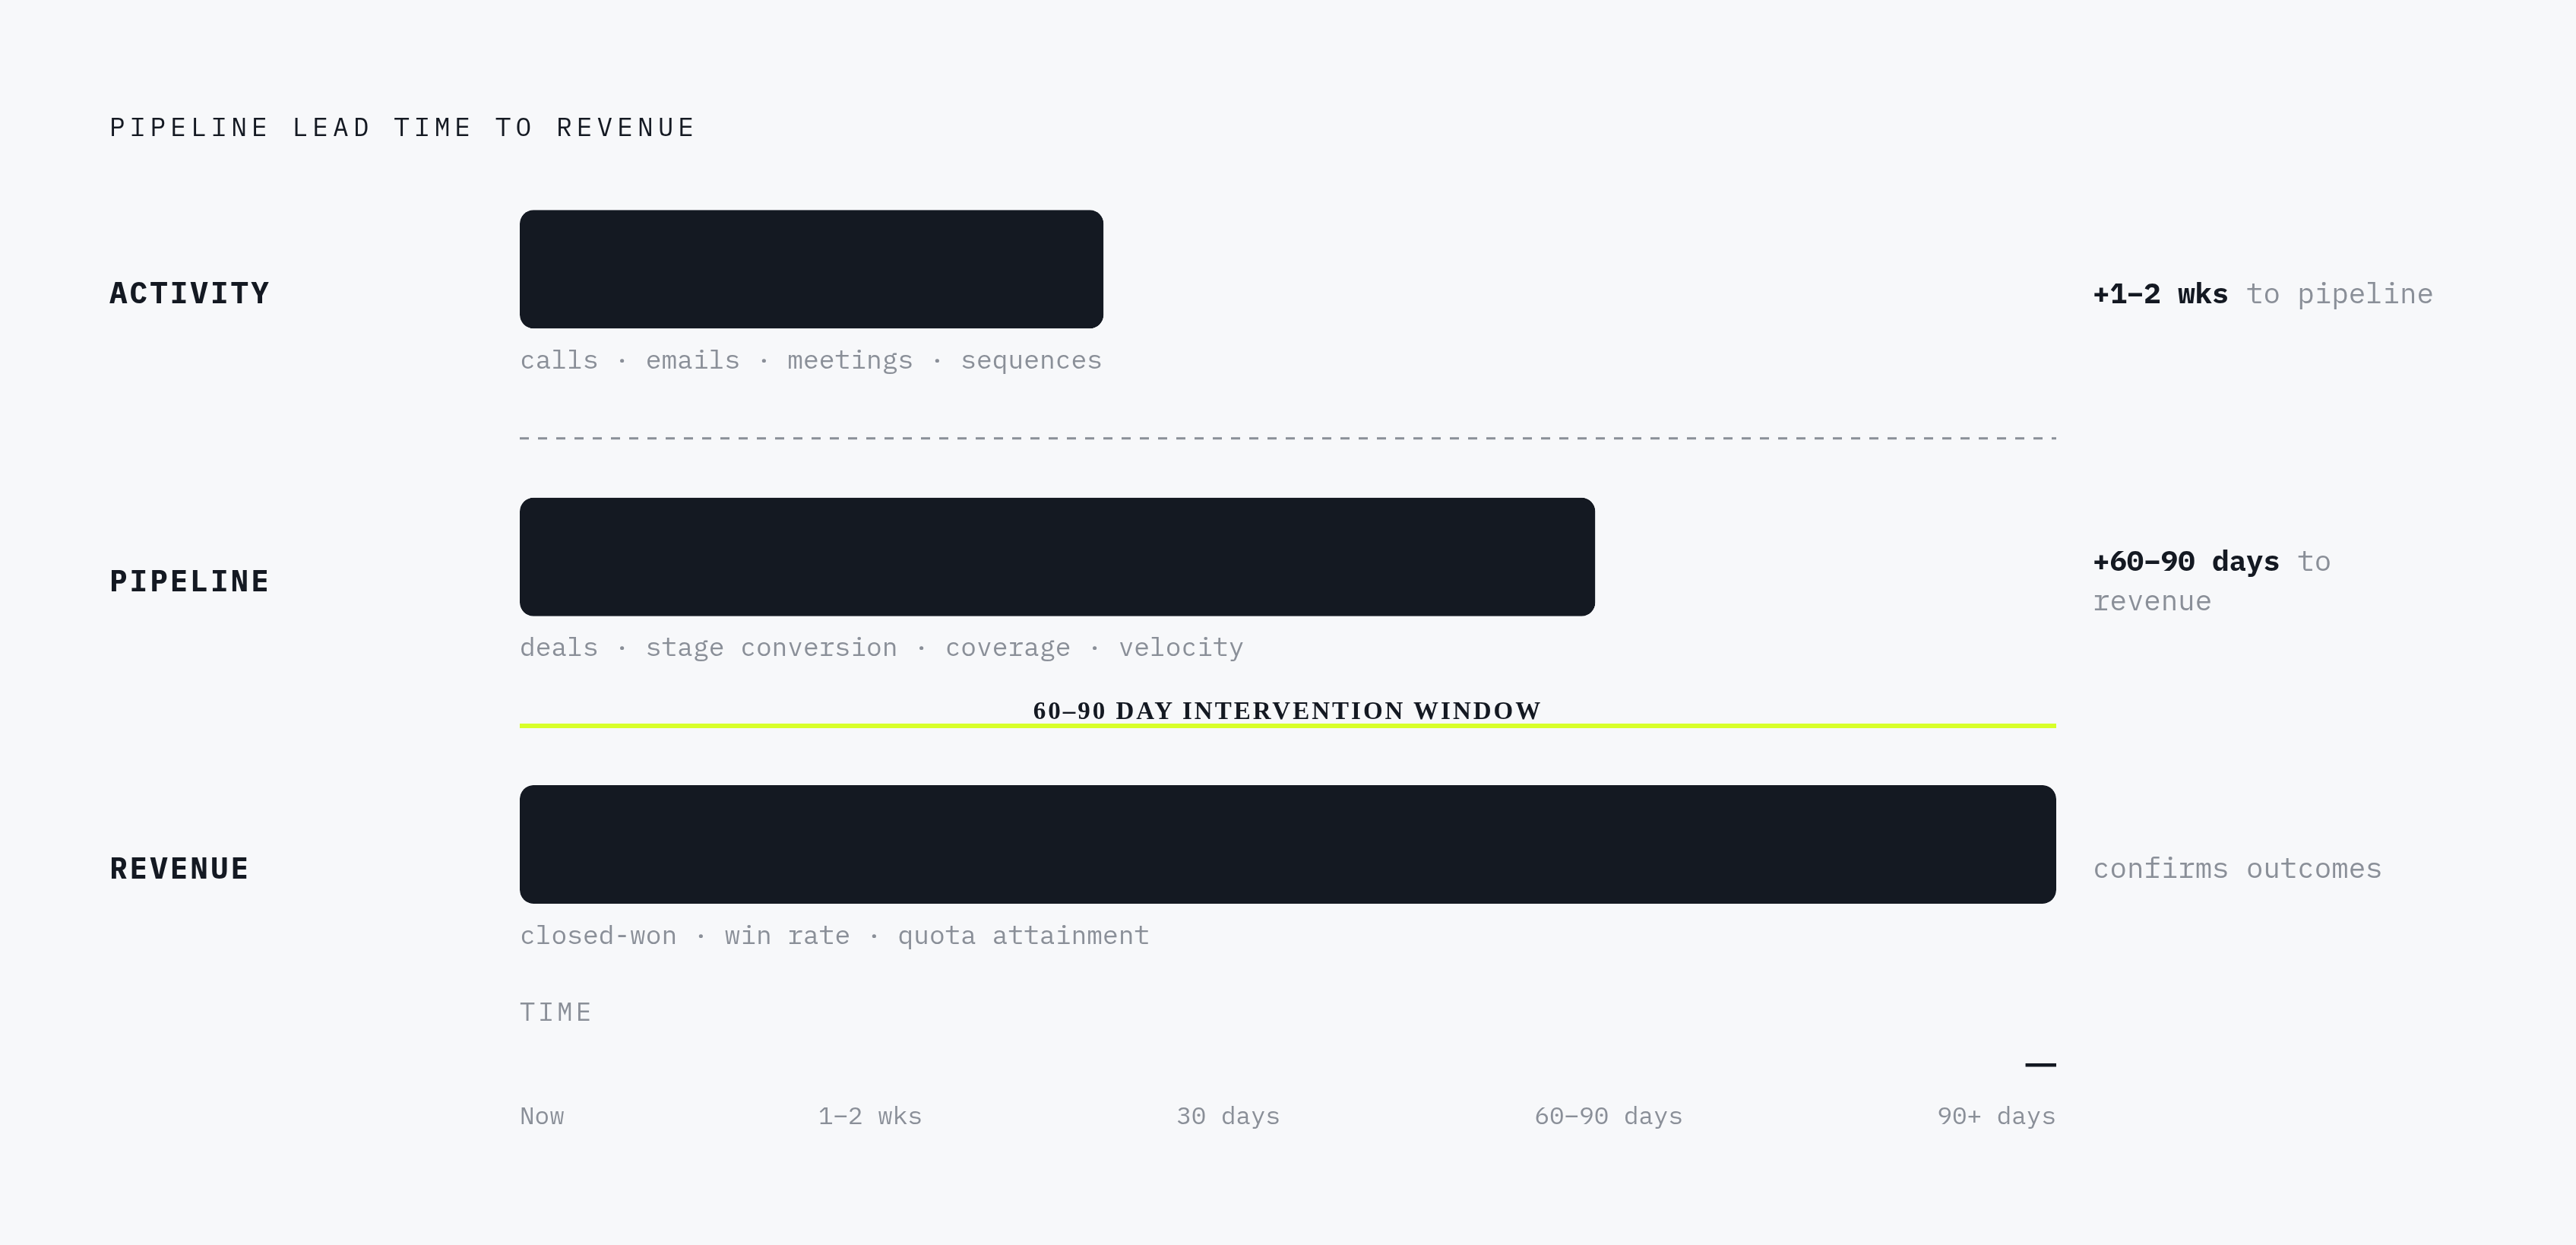
Every sales metric sits in one of three temporal layers. Which layer you are looking at determines whether you can act on what you see, or whether you are just reading history.
The first layer is activity: calls made, emails sent, meetings booked, sequences launched. These are leading indicators for pipeline, with roughly a one-to-two week lag. They tell you what is being seeded.
The second layer is pipeline: deals created, stage progression, coverage ratios, velocity. These lead revenue by sixty to ninety days. They tell you what is growing.
The third layer is revenue: closed-won deals, win rate, quota attainment. These confirm outcomes. They are useful for diagnosis, full stop.
The ratio that actually works in practice is about three leading indicators tracked for every lagging one. Enough predictive signal to act before outcomes are locked, not so many data points that the team is paralyzed by noise. Most organizations invert this, which is why Gartner puts enterprise forecast accuracy in the sixty-to-seventy-nine percent range. Those forecasts are built on rep-submitted confidence scores and late-stage pipeline snapshots, lagging signals wearing the costume of predictions. Every section that follows lives at a specific position on this timeline, and knowing where a metric sits tells you exactly how much time you have left to respond to what it shows.
Why Raw Activity Volume Is a Weak Predictor on Its Own
Activity volume is the most commonly tracked leading indicator in sales. It is also the most overrated. I have sat in enough pipeline reviews to watch managers celebrate call volume while their reps were quietly losing qualified deals in late-stage limbo. Volume without conversion is noise with a timestamp.
Here is what actually matters about time: reps spend only about thirty percent of their week on revenue-generating activities, per Salesforce's 2024 State of Sales research. The rest goes to admin, data entry, internal meetings, CRM cleanup. That context is everything when you are trying to interpret activity benchmarks. An SDR averaging ninety-plus daily activities is not the same thing as a rep systematically advancing qualified pipeline. The relevant question is what fraction of those touches produce a qualified conversation, not how many touches occurred.
The diminishing returns on high-volume outreach are real and documented. Cold email reply rates have been declining for years, sitting in the low single digits on average. Cold call connect rates leave the majority of dials unanswered. Single-channel, high-volume outreach is a volume game being played on a field that keeps shrinking. Anyone who has managed an outbound team in the last three years has felt this viscerally.
Activity volume has exactly one legitimate use: it functions as a floor metric. It tells you whether reps are showing up and executing. That matters. But it becomes genuinely predictive only when tied to what happens next in the funnel, which means it earns its value as a preamble to stage conversion data, not as a standalone number worth celebrating.
Stage-Conversion Rates as the Most Granular Revenue-Predictive Signal
If you can only add one metric to your weekly review cadence, make it stage conversion rates. These numbers move before revenue does, often by sixty to ninety days, which means a drop in MQL-to-SQL conversion this week is a revenue problem you can still solve, if you catch it now.
The MQL-to-SQL transition is where most B2B funnels bleed. Only a fraction of marketing-qualified leads advance to sales-qualified status in typical organizations, and that fraction fluctuates based on lead source quality, messaging alignment, and how rigorously your SDRs are actually qualifying. A sustained decline in that conversion rate is one of the earliest signals available that something upstream has broken. In my experience, it usually points to one of three things: the ICP definition has drifted, the lead source has deteriorated, or the qualification script has gone stale. All of them are fixable, but only if you catch them before they become a Q4 miss.
Further down the funnel, meeting show rate and meeting-to-opportunity conversion are the next critical checkpoints. A healthy outbound program maintains a show rate well above fifty percent and converts at least one in four meetings into qualified opportunities. When those numbers slip, the problem is almost always in discovery or qualification, not in outreach volume. That distinction matters because the interventions are entirely different. Sending more emails does not fix a broken discovery conversation.
Speed to lead operates at the very top of the funnel and functions as a conversion multiplier. Leads contacted within five minutes convert at dramatically higher rates than those reached after thirty minutes, yet most companies take hours to respond to inbound leads. That gap is not a minor inefficiency. It is systematic destruction of conversion rate at the very first touchpoint.
The diagnostic power of stage conversion data is what makes it the most valuable metric on this list. When revenue misses, working backward through conversion rates at each stage reveals where the funnel actually broke. That analysis is only possible if teams are tracking stage-level data in near real time, reviewed weekly rather than surfaced in a monthly report after the quarter has already moved on without you.
Pipeline Coverage Ratio: What It Tells You and Where It Misleads
Pipeline coverage is simple to calculate and surprisingly easy to misread. Total qualified pipeline value divided by revenue target. The standard rule of thumb, and it is a rule of thumb, not a law, says open pipeline should sit at three to four times quota for the period. One million dollar target, three to four million in qualified opportunities.
The problem lives in the word "qualified." Fullcast's 2025 Benchmarks Report found that high-ICP accounts make up only about a quarter of total pipeline for many organizations. The rest occupies space in the CRM without representing real probability of revenue. I have seen teams walk into a board meeting with five-times coverage and still miss the quarter by twenty percent, because half that pipeline was deals they had already lost emotionally but had not yet updated in Salesforce. Gross coverage numbers routinely overstate real opportunity when pipeline hygiene is poor. Coverage built on low-quality deals is not coverage. It is optimism quantified.
The benchmark also varies by segment in ways that matter. Enterprise teams with lower win rates need substantially more coverage to forecast reliably. High-velocity SMB teams closing more than half their qualified deals can operate with less. Applying the three-to-four multiple uniformly across segments is a category error that produces false confidence in some places and unnecessary alarm in others.
Track coverage weekly, segmented by deal quality and ICP fit, not as a quarterly snapshot. Movement in qualified coverage two to three months before quarter-end is the signal that matters. Coverage tells you how much pipeline you have. The next metric tells you whether it will convert in time.
Pipeline Velocity as the Single Best Predictor of Quarterly Revenue
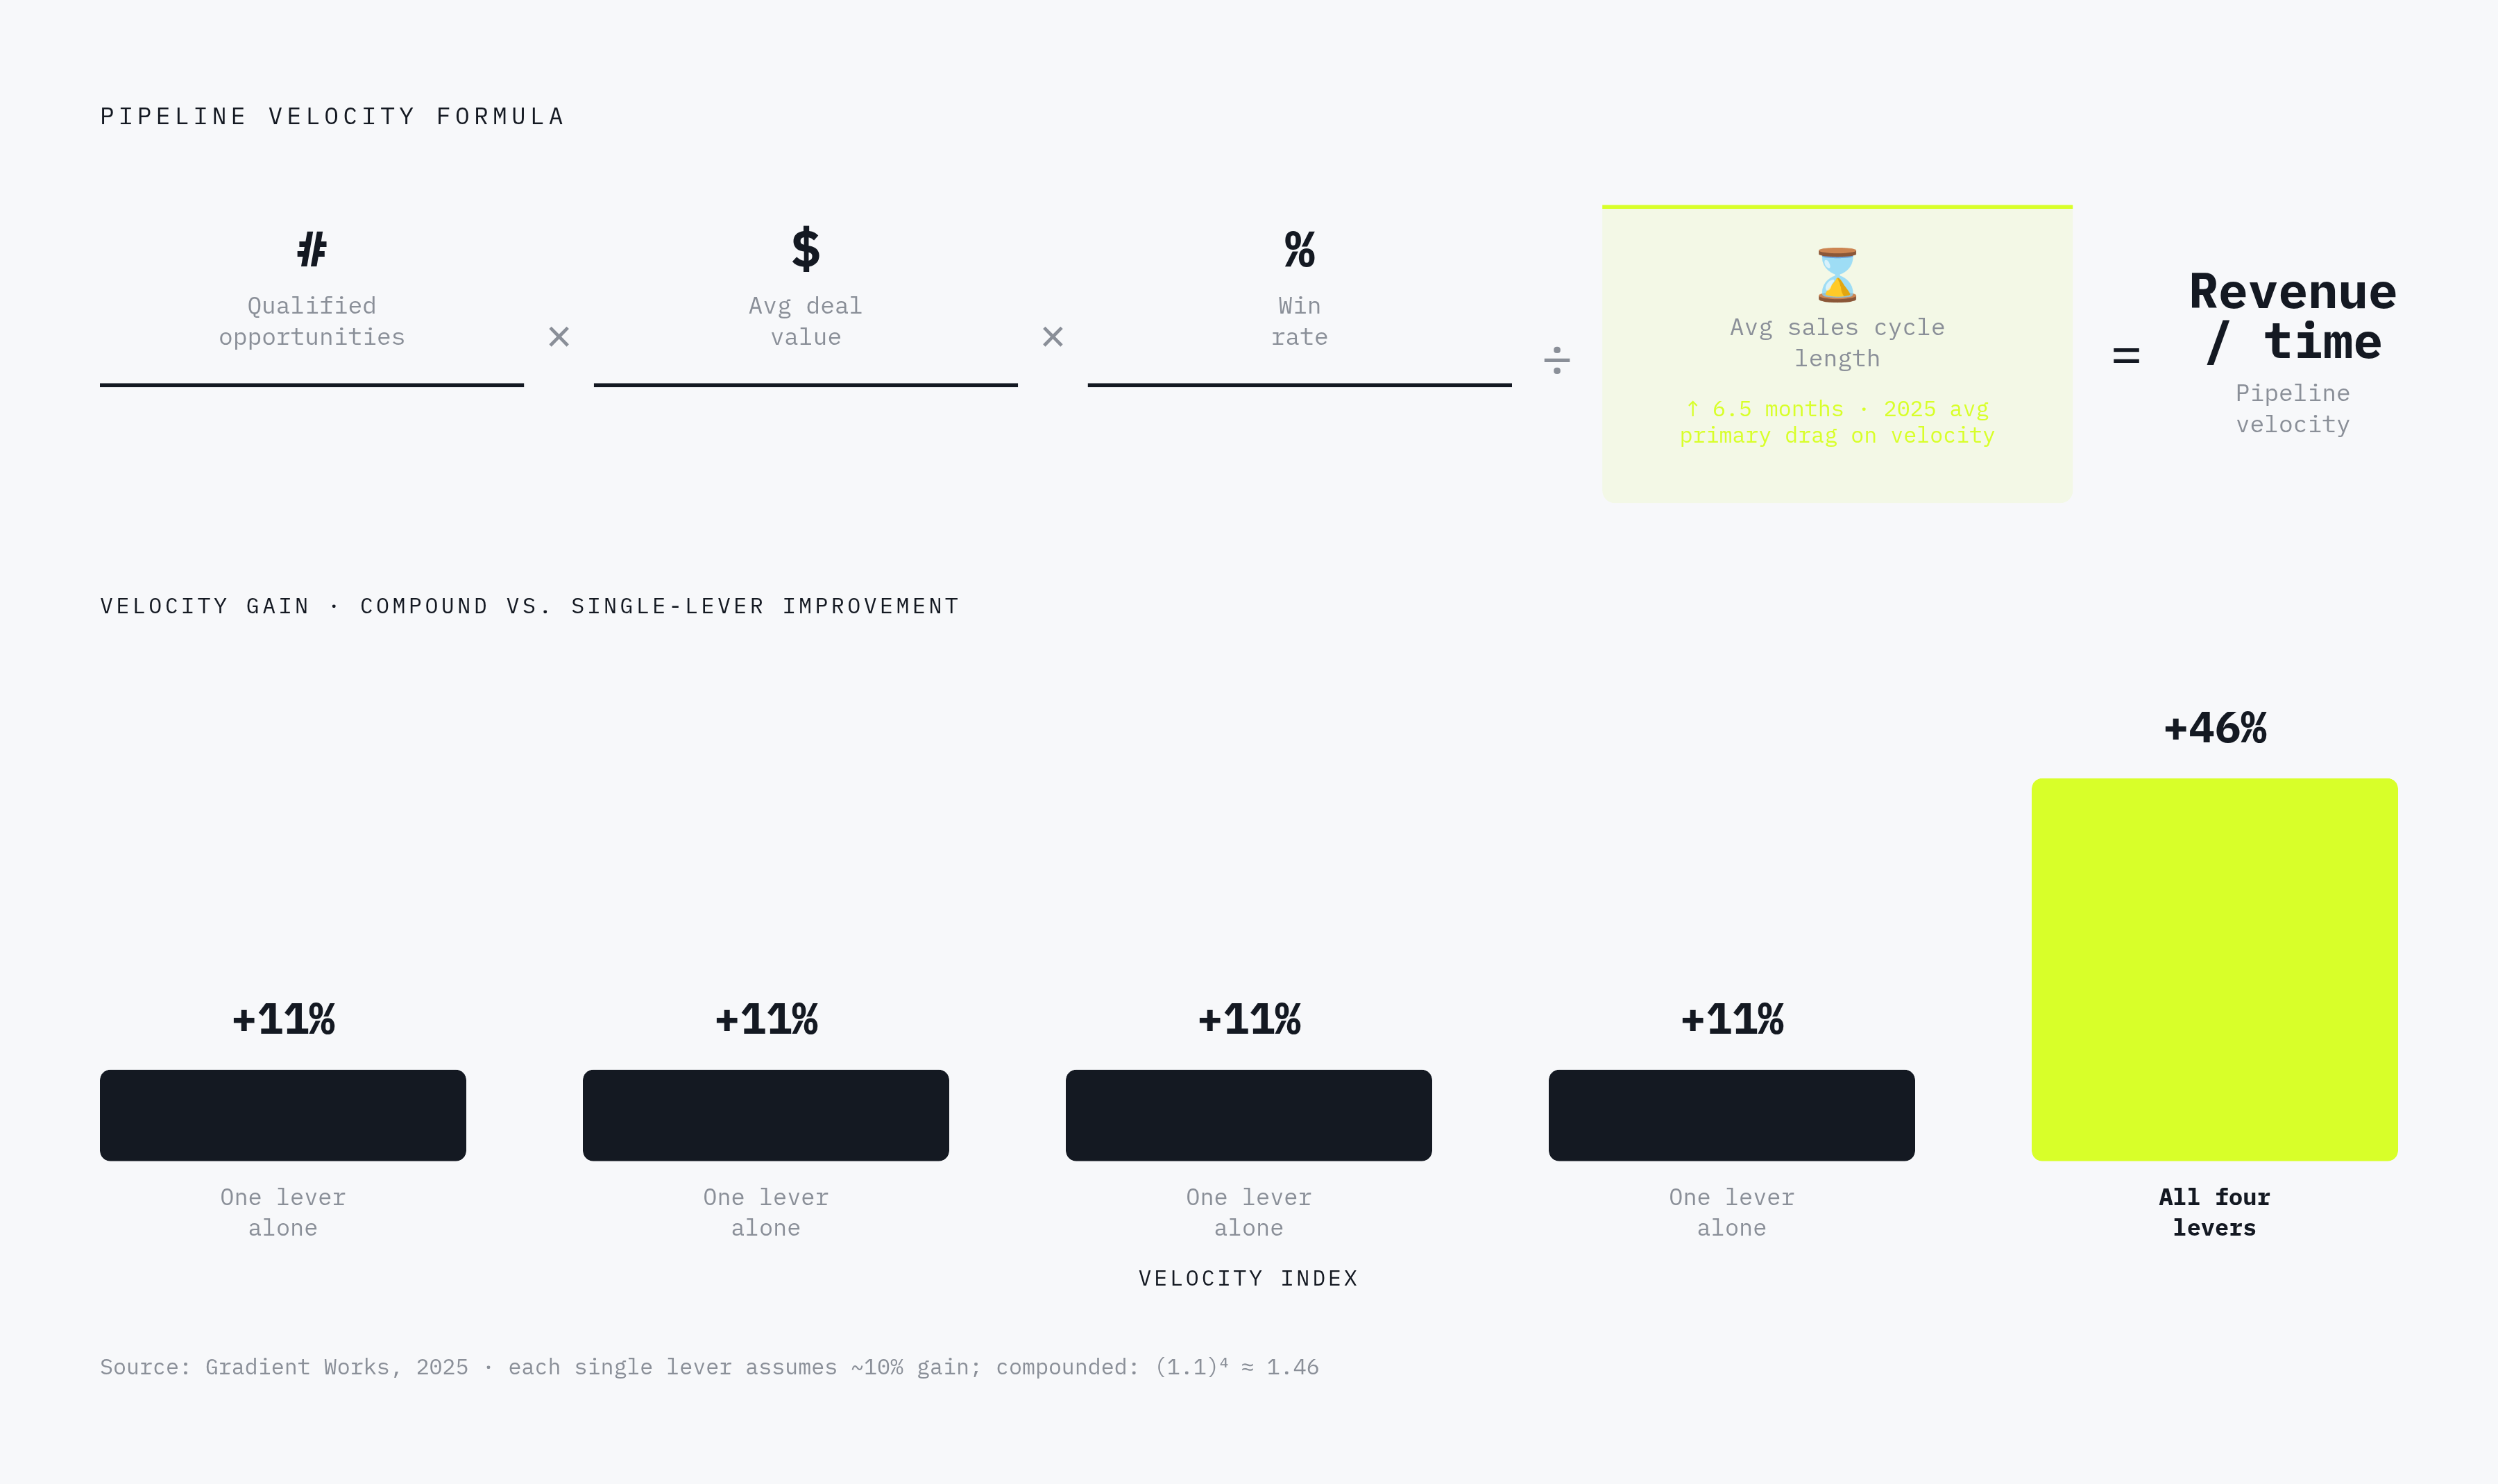
Pipeline velocity earns the "single best predictor" designation because of what it actually contains. The formula: number of qualified opportunities, multiplied by average deal value, multiplied by win rate, divided by average sales cycle length. Four variables, one output that tells you how much revenue the pipeline machine produces per unit of time.
What makes velocity genuinely predictive rather than retrospective is that it surfaces which of the four levers is dragging before the quarter closes. A drop in velocity driven by lengthening sales cycles points to a different intervention than a drop driven by declining win rates or shrinking deal sizes. The metric does not just tell you performance is slipping; it tells you where to press. That specificity is what separates it from every other revenue metric.
The compounding math is worth understanding intuitively. A modest improvement across all four components simultaneously produces a disproportionately larger gain in total velocity than improving any single lever alone. This is why diagnosing the weakest component per segment and fixing it precisely matters more than spreading improvement effort evenly across the board.
The denominator has been under sustained pressure. The average B2B deal took roughly six and a half months to close in 2025 per Gradient Works, and deals that exceed average cycle length for their segment convert at dramatically lower rates than those that close within it, per Forecastio 2024 data. Aging deals are a velocity drag that shows up in the metric weeks before they officially stall or die, which gives leaders time to intervene with re-engagement, executive involvement, or pricing adjustments before the deal goes cold. That window is the whole point.
Top-performing sales teams generate dramatically more pipeline velocity than bottom performers per Ebsta and Pavilion's 2025 data. The gap is not in activity volume. It is in the efficiency of each velocity component: better qualification producing higher win rates, tighter discovery compressing cycle length, stronger value articulation protecting deal size. Only a small fraction of sales teams currently track velocity systematically, which means building that discipline is a real competitive advantage right now, not a theoretical one.
Win Rate and Quota Attainment as Diagnostic Tools, Not Forward Signals
Win rate drops in the data after the deals that drove the decline have already been lost. By the time the number moves visibly on a dashboard, the chance to intervene in those specific deals is gone. That is the definitional problem with win rate as a leading indicator: it is not one.
Its leading counterpart is late-stage conversion rate, specifically the transitions between stages where deals are typically won or lost. Those move first, often by weeks, and give sales leaders the advance signal that win rate will eventually confirm. Teams that review stage conversion rates weekly are reading the same information that win rate eventually reflects, but at a point where something can still be done about it. The insight is the same; the timing is everything.
Quota attainment operates identically. It is a retrospective confirmation of what happened during the quarter. The predictive question, which reps are on track to miss, lives in pipeline velocity and stage conversion data mid-quarter, not in attainment numbers that arrive after the period closes. Win rates and quota attainment have declined materially across the industry in recent years. These headline numbers tell you the system is underperforming. They do not tell you where or why.
The right use of both metrics is as outcomes you are trying to predict. Build backward from them to the leading indicators that move first. Win rate and quota attainment are the destination coordinates; stage conversion and velocity are the navigation system. Confusing one for the other is how sales organizations end up surprised at the end of every quarter.
Rep Selling Time as the Meta-Metric That Determines Whether Activity Benchmarks Mean Anything
Every activity benchmark in sales, calls per day, emails sent, meetings booked, assumes a baseline of available selling time that most reps simply do not have. Salesforce's 2024 State of Sales puts the number at about thirty percent of the week spent on revenue-generating activities. The rest goes to admin, data entry, internal meetings, and research. This is not a behavioral problem unique to underperformers. It is a structural feature of how most sales organizations are built.
Top performers reach higher selling-time percentages, but they get there through process discipline and automation, not by working longer hours. The gap between top and average performers in available selling time, compounded across a full year, is equivalent to several additional weeks of productive capacity. That is not a marginal advantage.
When you read an activity benchmark, you have to read it against available selling capacity, not against the clock. A rep making a strong volume of calls per day is doing so from a very compressed window of actual selling time. If that window shrinks further, because of a new reporting requirement or a wave of internal meetings, the same call volume target becomes structurally impossible to hit without sacrificing quality somewhere. Volume benchmarks divorced from selling-time data are incomplete at best and actively misleading about rep capacity at worst.
The revenue consequence is direct. Slow follow-up on qualified leads and opportunities significantly reduces win rates, per Ebsta research. Rep time management is not a soft competency conversation. It is a metric that connects measurably to revenue prediction, and it belongs in the same analytical conversation as velocity and stage conversion. If you are diagnosing a pipeline problem and you have not looked at selling time, you are missing a variable.
Where Expansion Revenue Changes Which Leading Indicators Matter
Customer expansion now accounts for the majority of new revenue for many B2B companies, per Ebsta and Pavilion's 2025 GTM Benchmarks. This is a structural shift in where growth actually comes from, not a cycle. It changes which leading indicators deserve attention in ways that most measurement frameworks have not caught up to yet.
A sales leader whose forecast model is built entirely on new-logo activity metrics is tracking leading indicators for a smaller portion of the business than they realize. The leading indicators for expansion revenue are simply different: product usage signals, time-to-value in the customer journey, renewal engagement rates, and the depth of multi-threaded relationships within accounts. These move before expansion revenue does. None of them appear on a traditional SDR activity dashboard, and none of them will, because they belong to a different part of the organization tracking a different customer motion.
Revenue concentration compounds the issue. When a small fraction of sellers drives the majority of revenue, per Ebsta 2025 data, the leading indicators for those specific reps deserve disproportionate scrutiny. Their pipeline composition, velocity, and stage conversion rates are not just individual performance signals; they are organizational revenue signals. A deterioration in one top performer's velocity metrics can be equivalent to a team-level miss if the concentration is high enough. Most organizations do not weight their metric reviews this way.
The practical implication: segment your leading indicator framework by revenue type. New-logo and expansion revenue have different predictive signals, different cycle lengths, and different risk profiles. Running a single measurement system across both produces a blended picture that is accurate for neither, and it guarantees you will be looking in the wrong place when something starts to slip.
How AI Changes the Speed and Reliability of Acting on Leading Indicators
The structural weakness of leading indicators has always been data latency. A leading indicator is only useful if it reflects what is actually happening in the field in close to real time, which historically depended on reps logging activities consistently and CRM data staying clean. Both have been chronically unreliable in practice. The insight was theoretically available; the infrastructure to surface it reliably was not.
AI tools address this at the data layer. Automated activity capture removes the dependency on rep logging discipline. Real-time pipeline scoring and predictive deal health flags reduce the lag between what happens in a customer conversation and what appears in the forecast. Reps who effectively use AI tools are substantially more likely to meet quota than those who do not, per Gartner's 2024 seller survey. The mechanism is not that AI is doing the selling. It is that AI removes the friction from the activities that generate leading-indicator data in the first place.
AI-assisted teams see meaningfully shorter deal cycles and significant productivity gains per Bain's 2025 analysis. Both outcomes improve pipeline velocity directly. Faster cycles reduce the denominator in the velocity formula. Higher productivity means more qualified opportunities moving through the numerator. That connection is not coincidental; it is the operational link between AI adoption and improved forecast reliability.
The outreach layer matters here too. AI-assisted sequence writing, follow-up personalization, and response-time automation affect conversion metrics at the stage level. Faster, better-targeted outreach improves show rates and meeting-to-opportunity ratios, the granular leading indicators that move first in the funnel.
Tracking stage-conversion rates in near real time requires systems that can surface pipeline signals weekly rather than monthly. Platforms like Letterstory, which embed conversion benchmarking into content and campaign workflows, allow marketing leaders to see how messaging shifts MQL quality upstream before the impact shows up in closed revenue. Gartner projects that a substantial majority of B2B sales workflows will be partly or fully AI-assisted by 2028. The teams building leading-indicator discipline now are the ones who will know how to interpret and act on those AI-generated signals when they arrive at scale.
Building a Metrics Stack That Lets You Intervene Before the Quarter Is Lost
Three layers. Each one feeds the next.
Daily: activity metrics. Calls, emails, multichannel sequences, speed-to-lead response time. These tell you whether reps are executing and whether the top of the funnel is being seeded. They are a floor check and an early-warning system for pipeline about two weeks out.
Weekly: pipeline metrics. Stage conversion rates, pipeline coverage segmented by ICP quality, velocity broken out by segment. These give you sixty to ninety days of advance signal on revenue. The weekly velocity review is the highest-leverage habit in this layer; it surfaces which of the four velocity components is weakening in time to actually do something about it within the quarter. I have seen this single habit change how a sales leader runs their one-on-ones, their forecast calls, and their escalation decisions, all because they finally had a signal that arrived before the damage was done.
Monthly and quarterly: outcome metrics. Win rate, quota attainment, expansion revenue. These confirm what the leading indicators predicted. Useful for calibration, not intervention.
The ratio of roughly three leading indicators for every lagging one gives the framework its discipline. Enough forward signal to act; not so many metrics that the team is reading dashboards instead of running deals.
The earliest warning available in this system is a sustained decline in stage conversion rates, particularly MQL-to-SQL or meeting-to-opportunity, sixty to ninety days before quarter-end. That is a revenue problem that is still solvable. The same signal surfaced as a win rate decline after quarter close is not solvable retroactively. It becomes a slide in the board deck.
What makes this framework fail is worth naming directly: garbage CRM data, low rep selling time, pipelines padded with low-ICP deals. No metric resolves these on its own. But leading indicators surface them faster than lagging ones do, and surfacing a structural problem earlier is the difference between fixing it in-quarter and explaining it after the fact. That distinction is the entire argument.