Sales Rep Productivity Metrics Worth Tracking
Track these metrics to spot productivity gaps before they become quarter-end problems.

Here's a number worth sitting with: per the 2025 GTM Benchmarks, just 14% of sellers drive 80% of revenue. That's roughly an 11x gap between the top and bottom performance quartiles, a spread wide enough to separate two reps on the same floor, with the same product and the same comp plan, into entirely different tiers of outcome.
A separate Ebsta dataset, spanning 4.2 million opportunities and $54 billion in revenue, tells a nearly identical story: 17% of reps generate 81% of revenue. Two datasets, two slightly different cuts, one consistent picture.
This concentration is a visibility story more than a talent story. Teams without the right metrics can't see what the top performers are actually doing differently, so they can't coach toward it, can't hire for it, and can't catch a rep sliding toward the bottom quartile until the quarter's already lost. That reframes the whole exercise: the metrics worth building a stack around are the ones that expose the mechanism behind the top 14%'s advantage, and less the ones that simply confirm they're winning. Which raises the obvious question the rest of this piece tries to answer: what actually distinguishes them?
Quota attainment as a diagnostic, not just a scoreboard
Quota attainment is actual sales divided by sales quota, expressed as a percentage. It's the most basic productivity number in sales, and also the most commonly misread, because most managers treat it as a binary: did the rep hit it or not?
Read as a distribution instead, and it starts telling you something. Per Optifai's Sales Ops Benchmark, covering 939 companies, the B2B average sits at 65% attainment industry-wide, with SaaS running slightly ahead at 70%, manufacturing at 60%, and professional services at 68%. A healthy team distribution looks something like 60 to 70% of reps hitting or exceeding quota, with a clear, diagnosable reason for every rep who falls below 80%. That last clause matters more than the percentage itself: "diagnosable" means you can point to a cause, not just a shortfall.
When attainment drops across several reps at once, the signal usually points to something structural: quota calibration set too aggressively, territories carved up unevenly, a product-market mismatch nobody's flagged, or a training gap that's been quietly compounding. And the pressure is rising even as the results slip: a significant share of companies raised quotas in 2024, up notably from the prior year. Rising quotas paired with falling attainment is exactly the kind of compounding problem that a single aggregate number will hide until it can't be ignored anymore. Track the distribution monthly, and flag cohort-level drops before they show up as a quarter-end surprise nobody saw coming.
Win rate: the efficiency number buried inside your pipeline report
Win rate is deals closed-won divided by total qualified opportunities, and it's the clearest available read on how well reps convert the pipeline they already have in hand. The B2B average sits at 21%, per industry sales research. Sit with that for a second: four out of five qualified opportunities are lost, on average, across the industry.
Two levers explain a meaningful chunk of that gap, and most teams aren't watching either one. Per the 2025 GTM Benchmarks, delayed deals see win rates drop by 113%, while early decision-maker involvement boosts win rates by 55%. Both are behavioral, both are visible in CRM data if the right fields are actually being tracked, and both make win rate a coaching metric rather than just a report you glance at in a pipeline review.
The useful move is to segment it: by rep, by deal source, by the stage a deal entered at, by deal size. The pattern that falls out tells you where the real leak is. A rep with low win rate and high activity has a prioritization problem, chasing volume instead of quality. A rep with low win rate but strong discovery notes has a late-stage execution problem, something breaking down between proposal and close. Same symptom, different cause, different fix.
Revenue per rep and what it hides about deal mix
Revenue per rep is total revenue divided by headcount, and it's the simplest gut check on whether a team's capacity matches its cost. Per Optifai's Sales Ops Benchmark, drawing on more than 2,400 reps in 2025, the median B2B SaaS rep carries $500K to $700K in annual quota capacity, with top performers clearing $1M or more. Early-stage companies run lower: $250K to $400K at Seed, $400K to $600K at Series A.
Here's where the number starts to mislead you if you're not careful. A rep carrying fewer, larger, longer-cycle deals shows lower revenue per rep in any single quarter, even when they're performing exactly as expected. And the mix underneath the number is shifting: expansion ARR now makes up 40% of total new ARR in 2025, up five points from 2024, meaning revenue per rep increasingly reflects renewal and account-growth work rather than pure new-logo hunting.
So the number needs company. Pair revenue per rep with sales cycle length and deal mix, and only then does the output figure mean something you can act on rather than something you just report.
Time spent selling: the input metric that predicts everything downstream
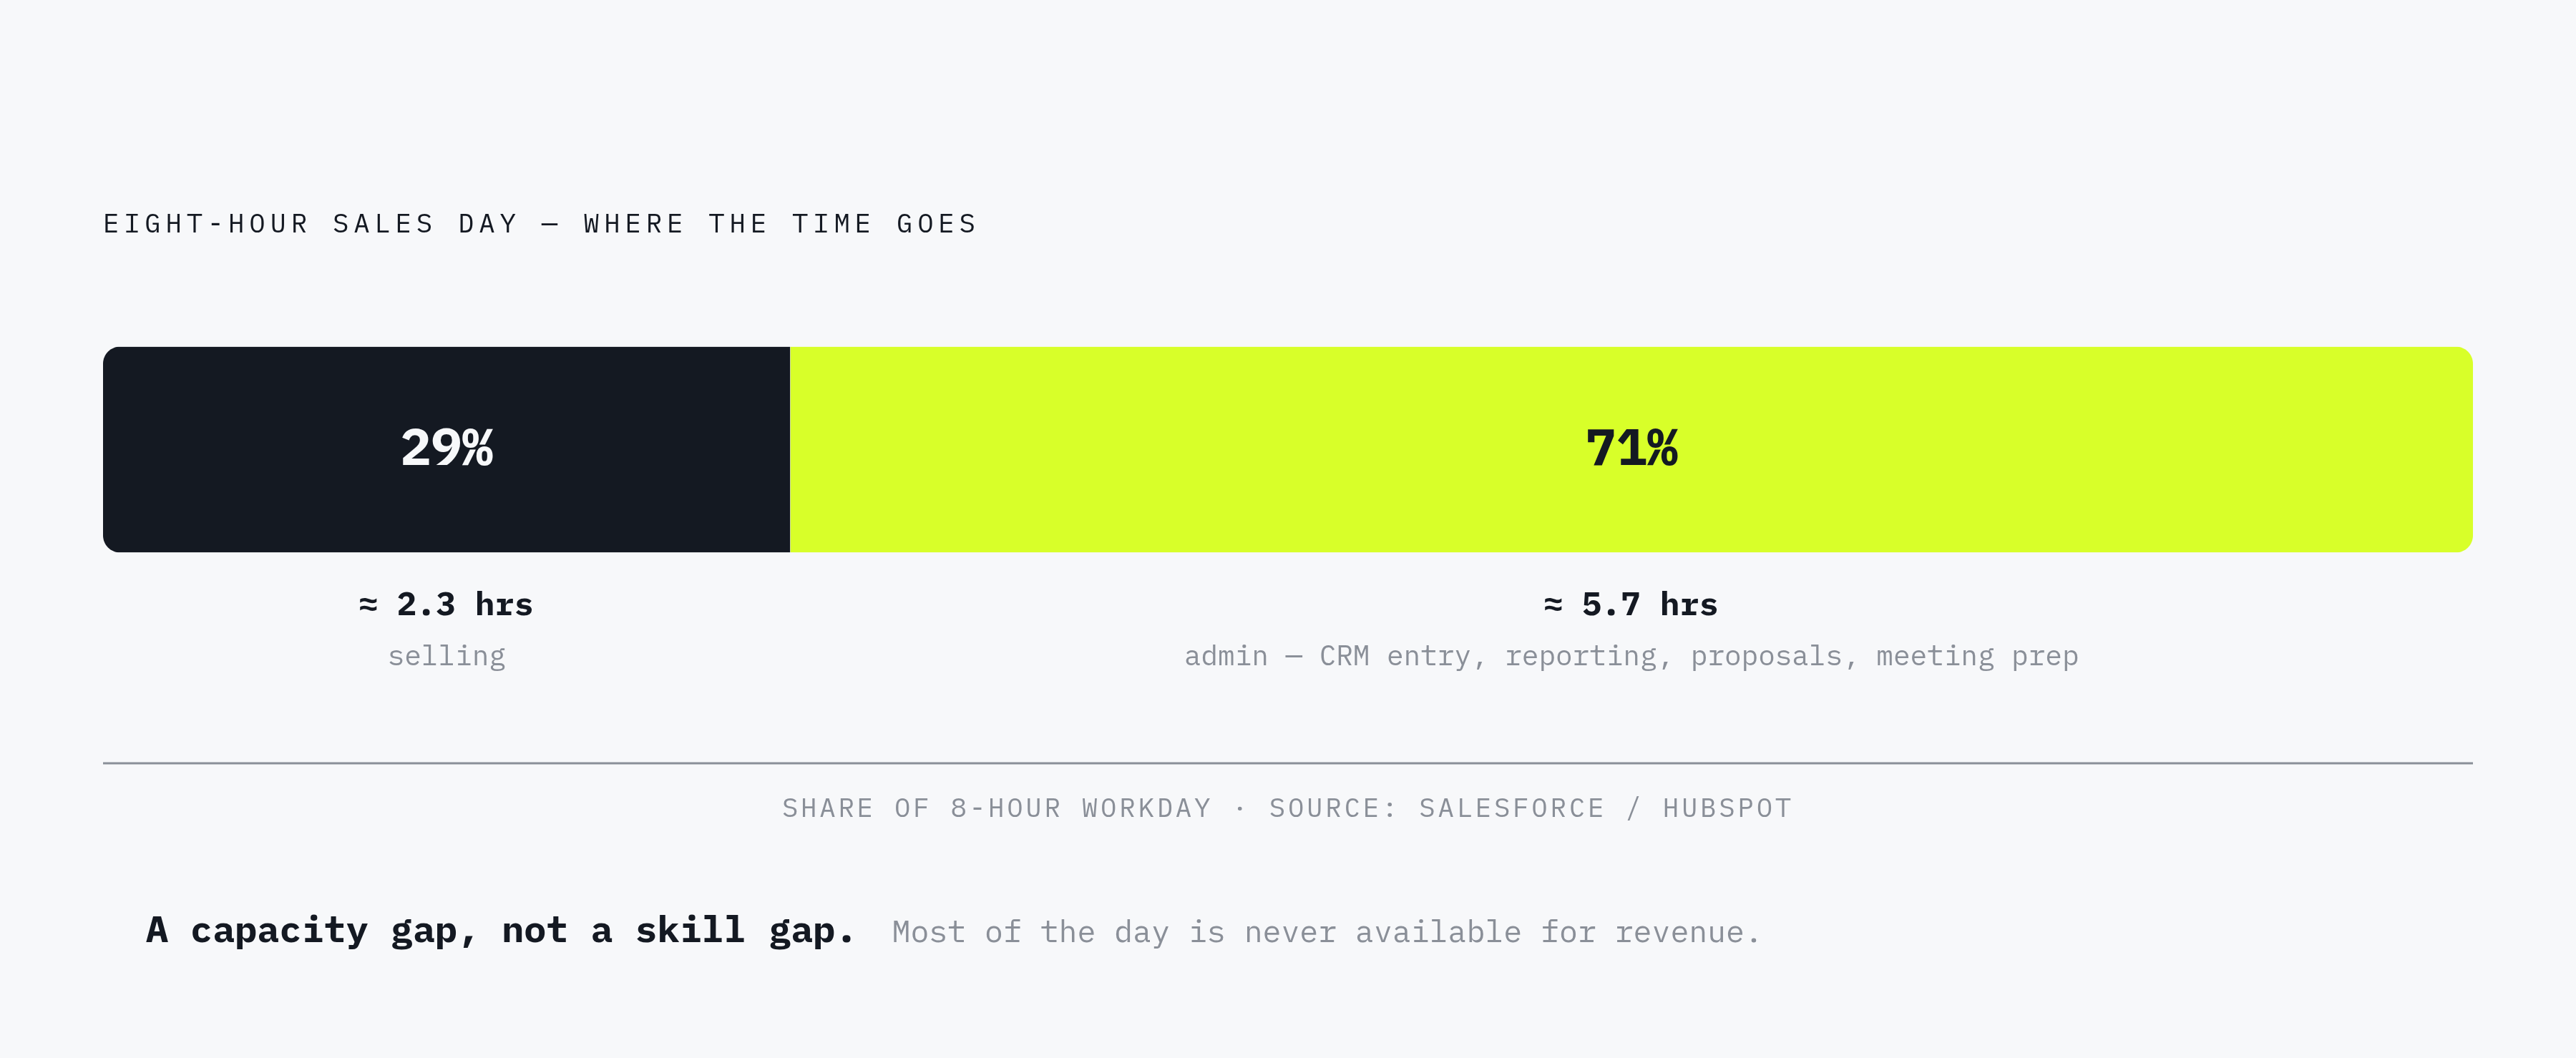
Salesforce research puts the share of a rep's time spent on actual revenue-generating activity at 28 to 30%. Other research lands in the same neighborhood, roughly two hours of real selling per eight-hour day. Read that twice, because it reframes the whole productivity conversation: the gap most teams are fighting is a capacity gap more than a skill gap.
Where does the rest of the day go? CRM data entry, internal reporting, proposal formatting, meeting prep, the unglamorous administrative work that builds up under every sales role. None of it is fake work, though most of it is automatable work, which is a different thing entirely.
Selling time functions as a leading indicator, and this is the part worth underlining: declines in it show up in the pipeline weeks before they show up in revenue. Catch a rep's selling-time percentage sliding in week three of the quarter, and there's still time to intervene. Wait for the revenue number to confirm the problem, and the issue has already grown from something small into something much harder to reverse. Companies adopting AI tools for the administrative layer report meaningful jumps in sales productivity, but that improvement is invisible unless selling time was being tracked before the tool showed up. You can't measure a lift off a baseline you never recorded. Practical tracking doesn't require new software, either: time-in-stage analysis, periodic calendar audits, and CRM activity logged by category will get you most of the way there.
Lead response time: the gap between interest and contact that most teams don't see
Only 27% of leads ever get contacted at all, per Salesforce. Read that number again, because it means most inbound interest, the stuff marketing worked to generate, simply evaporates before a rep ever picks up the phone.
A Harvard Business Review study covering thousands of U.S. companies found that firms contacting leads within an hour were far more likely to reach a real decision-maker and have a substantive conversation, while companies that waited 24 hours or more saw qualification rates fall off sharply. An hour doesn't sound like much until you consider what happens to a prospect's attention span in that window; interest fades quickly, and it fades faster than most sales orgs behave like it does.
Persistence compounds the issue. The average rep gives up after roughly one follow-up attempt, even though most deals require considerably more touchpoints before a prospect actually engages. The metric worth tracking is median first-response time, cut by rep and by lead source, because that segmentation tells you whether the problem is structural (routing delays somewhere in the handoff) or behavioral (reps simply not prioritizing new leads). And this connects directly back to win rate: an opportunity that never gets a timely first contact never gets a fair shot at entering the pipeline in the first place. The leak starts here, long before anyone's calculating a close rate.
Pipeline velocity: the one number that ties the others together
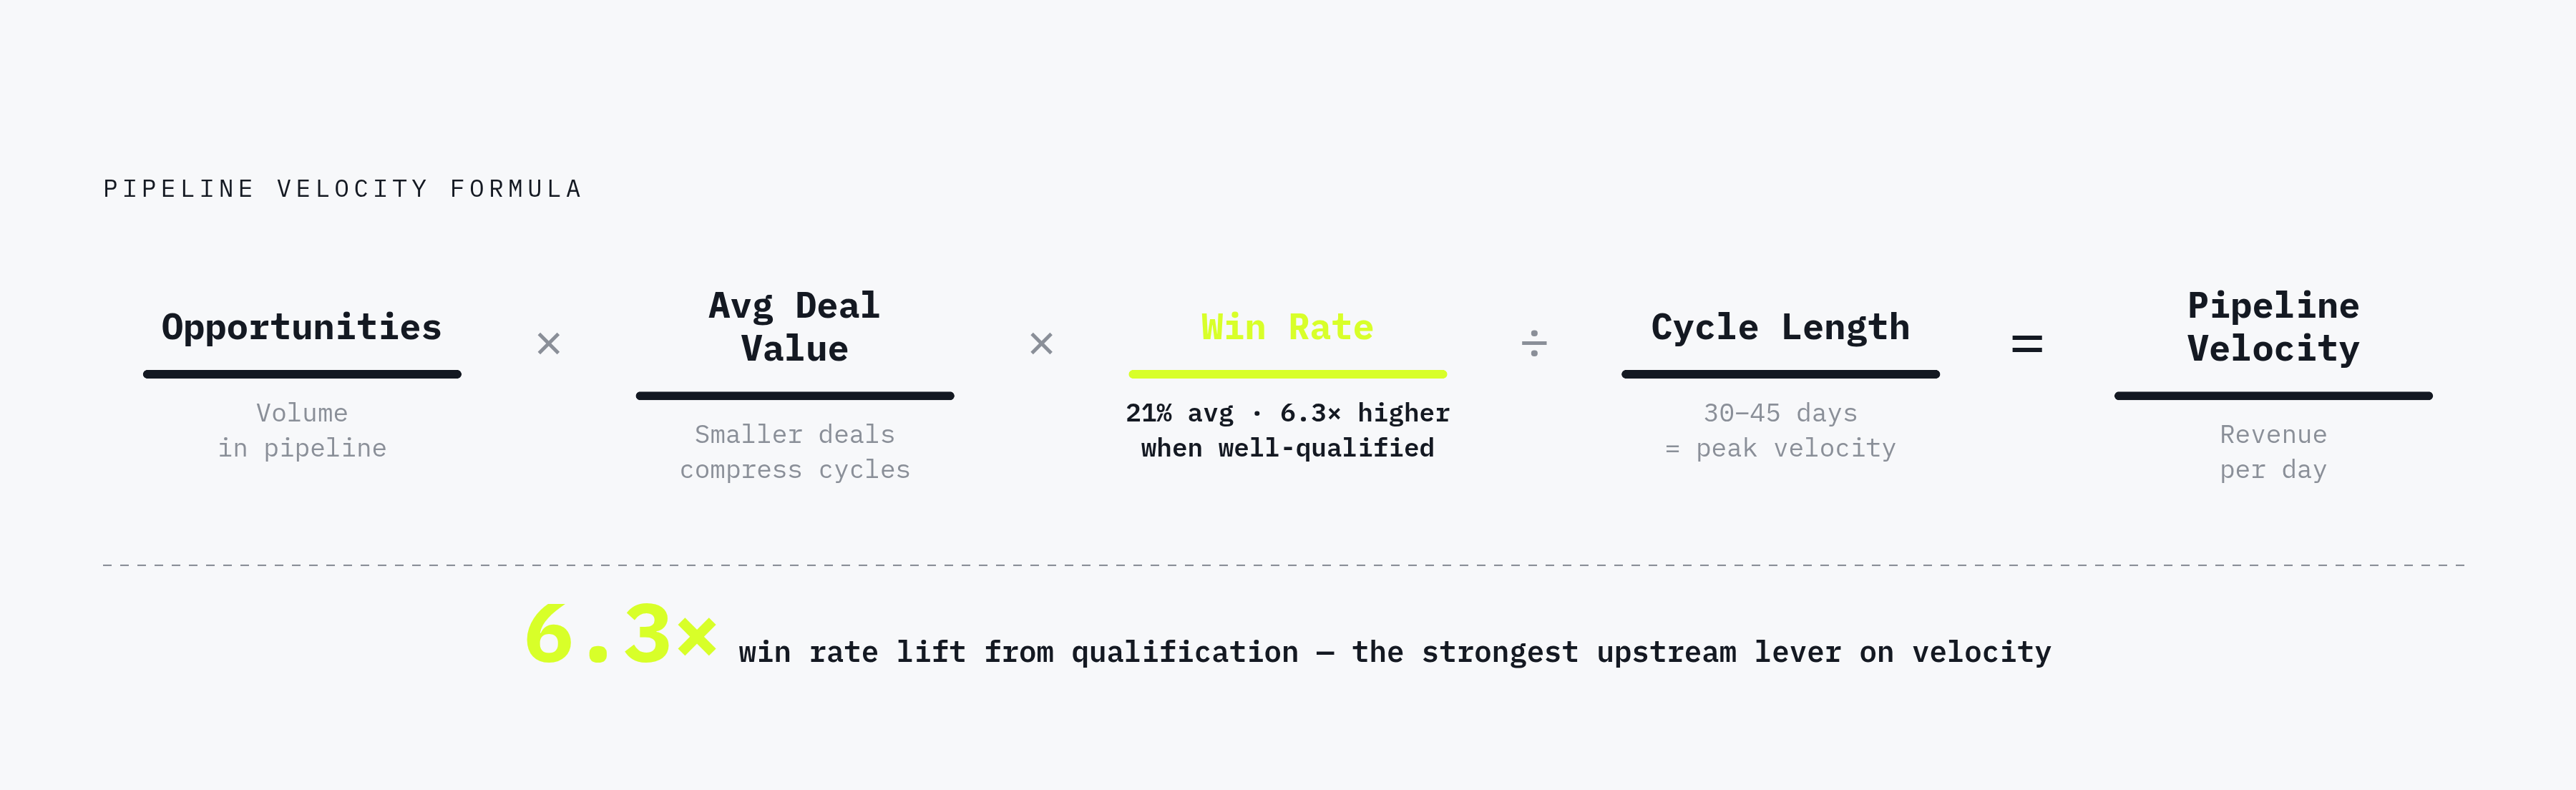
Pipeline velocity is the number of opportunities, times average deal value, times win rate, divided by average sales cycle length. It looks like a formula out of a finance textbook, but its value is entirely practical: when velocity drops, the formula tells you which variable moved. You're no longer guessing whether the problem is deal volume, shrinking deal size, weaker conversion, or a lengthening cycle. You just look at the inputs.
A 2025 First Page Sage analysis of 247 B2B organizations found that companies compressing sales cycles down to 30 to 45 days achieve notably higher velocity, though often by trading down to smaller average deal sizes, a tradeoff the formula makes explicit rather than hiding. And per the 2025 GTM Benchmarks Report, well-qualified deals win 6.3 times more often than poorly qualified ones, which makes upstream qualification arguably the single most powerful lever on velocity of anything in this article.
Track it weekly, at the rep level. A rep whose velocity is declining before their pipeline shrinks is giving you an early warning that no activity count will ever surface, because the rep might still be busy, still be making calls, still be logging meetings, while the underlying engine is quietly losing horsepower. Velocity is the metric that connects the effort side, response time, selling time, to the outcome side, revenue per rep, quota attainment, in one number a manager can actually watch without a spreadsheet degree.
Rep ramp time and what it costs when onboarding is treated as HR's problem
Ramp time is the stretch between a rep's hire date and the point they reach sustained quota performance, meaning consistent attainment at or above a high threshold, not just a lucky first close that gets everyone excited too early. Average ramp times in SaaS have stretched out considerably over recent years, and enterprise roles in particular can eat most of a year before a rep is fully productive.
Do the arithmetic on that. If a fully ramped rep sources several million dollars in pipeline annually, every month spent ramping is a month of foregone revenue, and that cost compounds with every open seat sitting unfilled while recruiting drags on. Onboarding gets treated as an HR checkbox exercise in a lot of organizations, which underserves how directly it drives revenue outcomes.
Coaching is the lever that compresses the timeline. Per Lead Forensics 2024, reps who receive strong coaching are substantially more likely to hit or beat quota, and more dynamic, ongoing coaching correlates with real gains in both attainment and win rate. Worth tracking: cohort analysis comparing time-to-80%-attainment across hiring classes, across managers, across whichever enablement program a given group ran through. The variation that shows up usually points straight at a coaching or onboarding gap. And this loops back to the concentration problem from earlier: if the top 14% of performers cluster under particular managers or particular cohorts, ramp data will reveal that pattern well before three years of quiet attrition prove it the expensive way.
Expansion and retention metrics: the productivity measures most sales orgs don't assign to reps
Customer expansion now accounts for 52% of new revenue in 2025, per Ebsta and Pavilion, which means retention and expansion metrics have stopped being a nice-to-have addition to a rep's scorecard and started being close to the main event.
Net Revenue Retention above 110% signals a rep who can grow revenue out of their existing book without sourcing a single new logo, a fundamentally different productivity profile than a rep doing pure new-business hunting, and one that most scorecards aren't built to see. Run the inverse scenario: a rep closes a batch of deals that all churn within a quarter. Quota attainment looks fine on the way in. Activity metrics look fine the whole time. The productivity math has actually gone negative, and nothing in a standard dashboard catches it until the damage is already booked.
Add NRR by rep or account owner, upsell and expansion rate, and churn rate segmented by each rep's closed cohort. All of it is trackable in a CRM with the right tagging discipline, which is the unglamorous part nobody wants to set up but everybody wishes they had six months later. Per the 2025 State of Sales research, 91% of sellers report win and close rates rose or held steady over the past year, and 93% say deal sizes held or grew, and expansion is increasingly where that growth actually lives. Frame it plainly for leadership: a rep who closes smaller deals but expands them reliably is outperforming a rep who closes big and watches it walk out the door a few months later. A metric set that can't distinguish those two reps is measuring noise rather than productivity.
Building a metric stack that actually gets used
Here's the failure mode almost every sales org has lived through at least once: a comprehensive metric framework gets rolled out with real enthusiasm during quarterly planning, and by week three, everyone's back to counting calls, because the new data isn't showing up in the rhythm anyone actually works in.
Cadence matters as much as the metric itself. Response time and selling time belong in a daily view. Pipeline velocity and win rate by stage belong weekly. Quota attainment distribution and ramp cohort progress make sense monthly. Revenue per rep and NRR by cohort are quarterly conversations, not weekly ones; checking them more often just adds noise without adding signal.
Ownership matters too. The stack works when reps see the exact numbers their managers see, because that shared visibility builds accountability on its own, without a manager needing to hover over every deal. Tracking quota attainment distribution monthly, for instance, requires a visibility layer most teams simply don't have: something that surfaces cohort-level patterns before they harden into a quarter-end surprise. Platforms like Letterstory, which monitor content and campaign performance over time, apply that same underlying principle to marketing metrics, and sales organizations need an equivalent layer of observability built into their own reporting rather than assembled from memory the week before a board meeting.
Where AI and automation genuinely help is in clawing back the 70% of the day currently lost to admin work, but that gain is only real if the freed hours actually get redirected into selling. Track selling time before the automation goes in and after, or the investment is a leap of faith rather than a verified return.
Before any one-on-one, the metric stack should be able to answer a single question: where is conversion breaking down for this rep, and what do they need to fix it? A number that can't answer that is overhead dressed up as management. Teams that keep counting what's easy to count will keep producing the attainment numbers the research already shows, hovering somewhere in the high 20s to low 30s percent hitting quota. The teams willing to measure what actually predicts revenue are the ones with a real shot at eventually becoming the 14% that drives most of it.