Sales Performance Metrics Every Manager Should Review Weekly
Weekly reviews catch pipeline drift before it becomes a missed quarter.

Pipeline reviews either catch trouble or they don't, and the difference usually comes down to rhythm. Weekly beats monthly, and this piece walks through the handful of numbers worth checking every week, what each one actually tells you, and why the cadence matters as much as the metric. I've sat through enough of these meetings to know which version is theater and which one is work, and the tell is always in how fast someone notices when a number moves.
Daily numbers are mostly noise. A rep making 40 calls Tuesday and 12 on Wednesday is just living through Tuesday and Wednesday, and reading a trend into that is like reading tea leaves at the bottom of a coffee mug. Monthly numbers show up too late to matter, and weekly sits in the gap between those two failures: enough data points to see a shape forming, early enough in the quarter to still do something about it. Companies running structured pipeline reporting tend to outperform those that don't, and that gain comes almost entirely from catching drift before it hardens into a missed number.
The sales environment that makes weekly visibility non-negotiable
Missing quota is the median outcome now, not the exception whispered about at kickoff, and Ebsta and Pavilion's 2025 GTM Benchmarks found 76% of B2B sellers missed quota in the first half of 2025. Ebsta's own 2024 B2B Sales Benchmarks showed win rates down 18% year over year, with cycles running 38% longer than in 2021. Layer on MarketSource's finding that 89% of B2B buyers reported a deal stall in the past year, and a picture forms: nearly every deal stalls somewhere, and the only real question is whether anyone's watching when it happens.
Headcount is part of why nobody's watching. Gartner puts the average B2B deal at 6 to 10 stakeholders, with enterprise deals climbing past 17. More people in the room means more silent corners for a deal to go quiet in, and quiet corners are exactly where monthly reviews fail to look.
Add it up and a monthly review starts looking less like oversight and more like an autopsy. The manager checking in once a month learns a deal died three weeks after it flatlined, which is a strange way to run a team if you think about it for more than five seconds. Weekly review is how you catch the stall while there's still a pulse to check.
Win rate: what it reveals about qualification, positioning, and coaching gaps
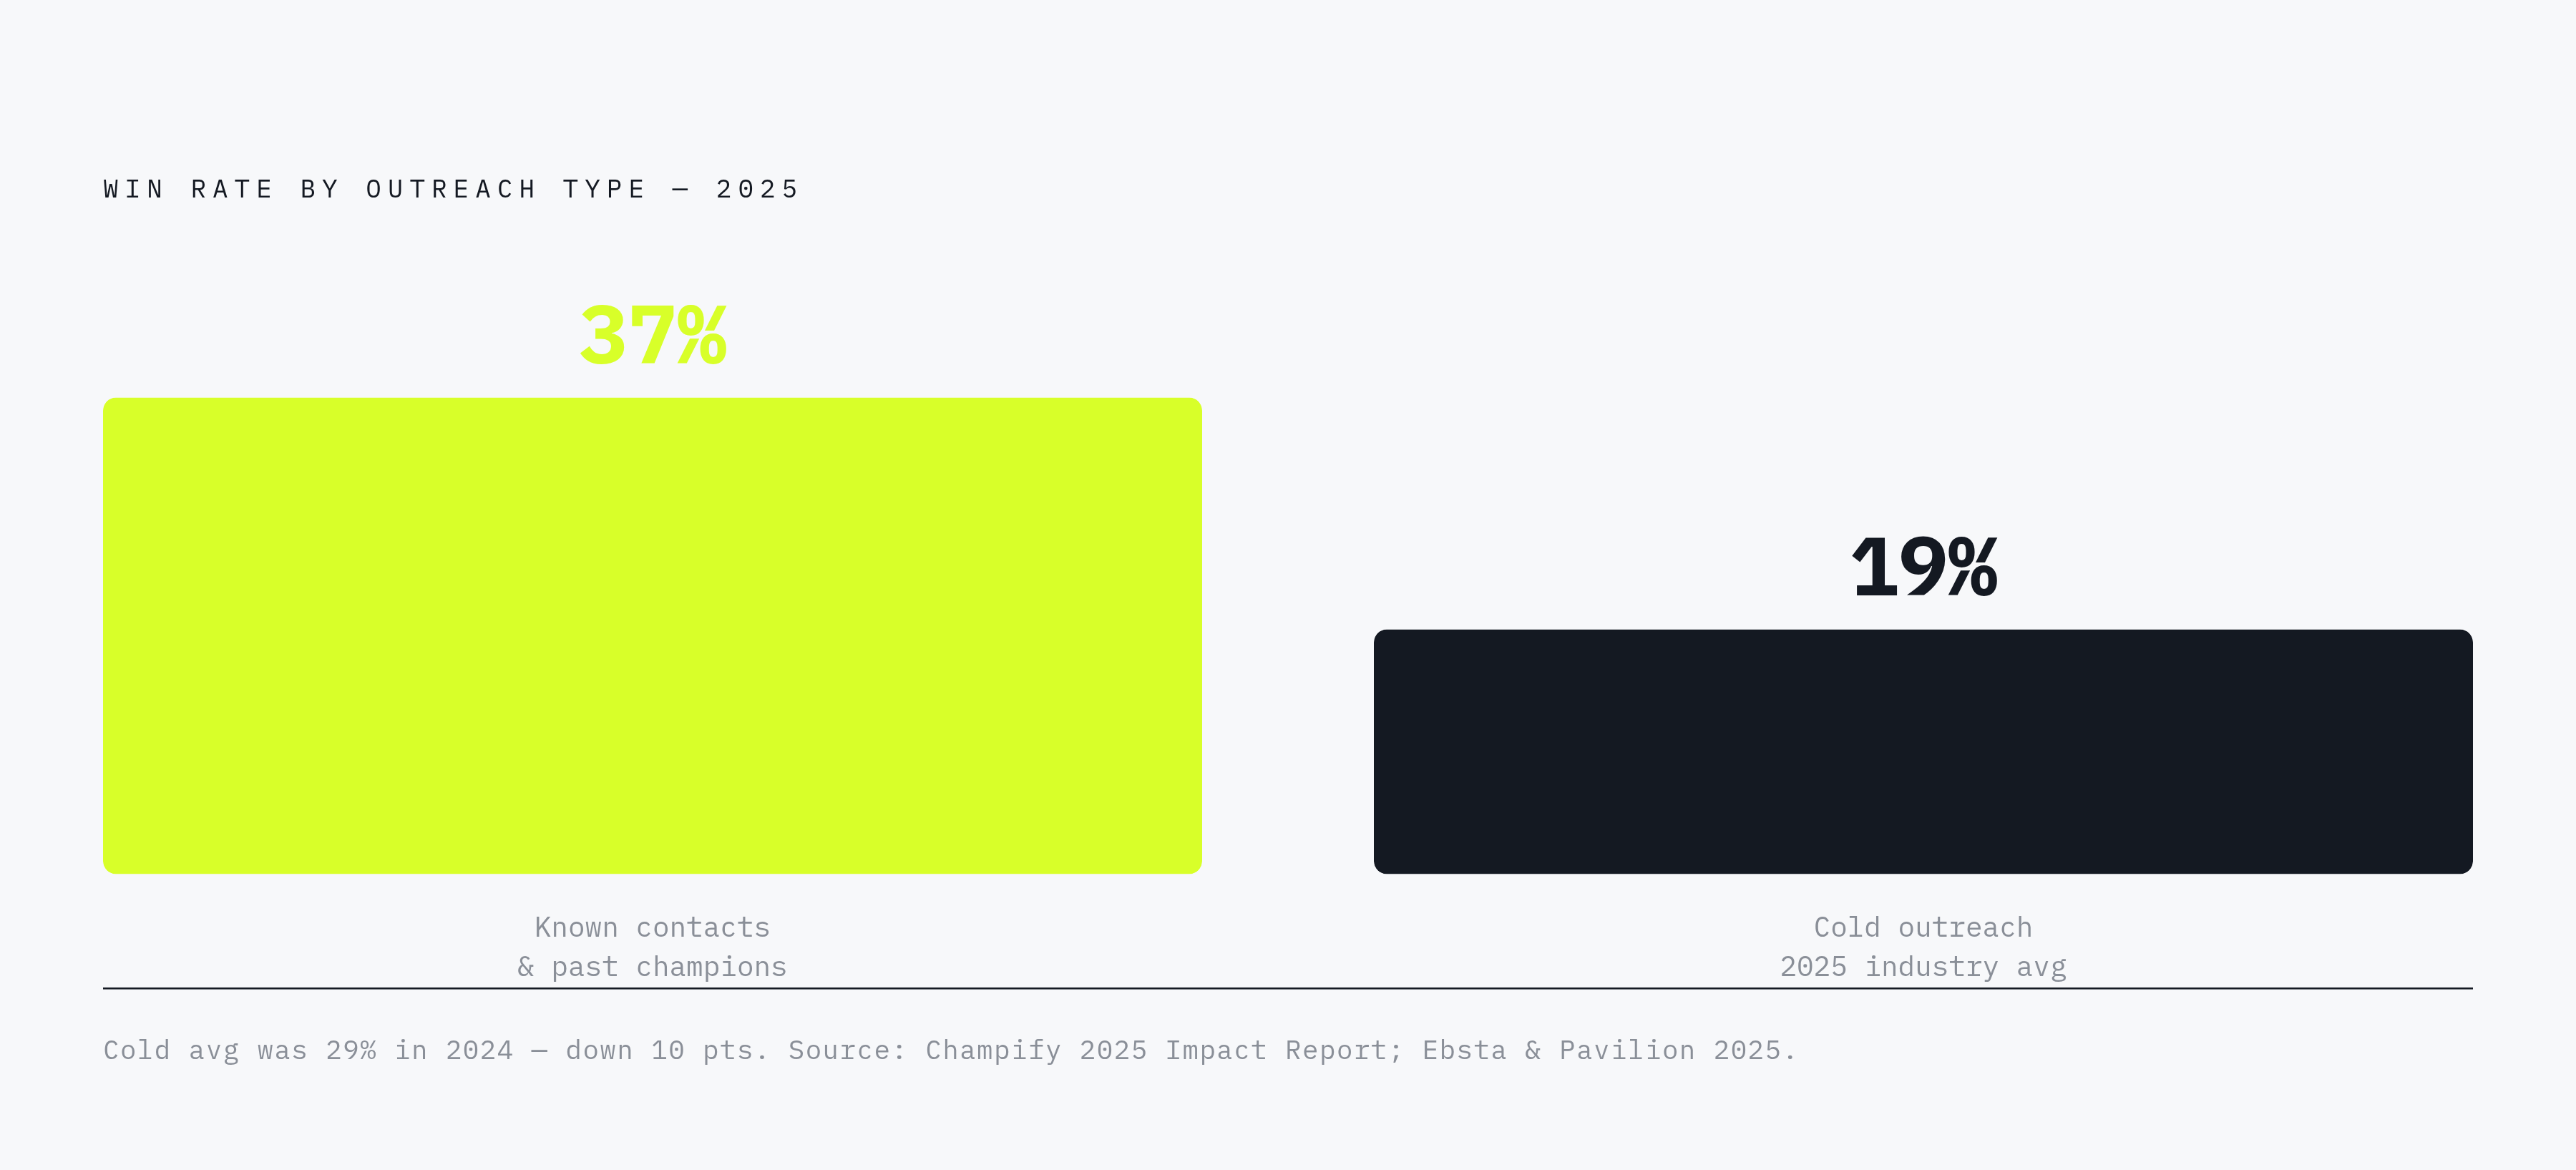
Win rate is deals won divided by deals pitched, times 100, and the industry number is sliding fast. Ebsta and Pavilion's 2025 data put it at 19%, down from 29% the year before, ten points gone in a single year, and that's not a rounding error.
Healthy B2B SaaS win rates usually run 20% to 30%, with the best teams clearing 35%. Enterprise motions land closer to 20% to 25%; SMB can run higher, 30% to 40%. But here's a wrinkle worth sitting with: Champify's 2025 Impact Report found that selling to known contacts or past champions produces a 37% win rate against 19% for cold outreach. Who you're calling seems to matter more than how many times you dial, and that alone should reshape how a rep spends Monday morning.
So what earns a second look on a Monday? A sharp drop, say from 25% into the low teens, almost never starts as a rep problem. Check ICP fit first, then check whether qualification is rigorous or just optimistic guessing dressed up in a CRM field. Check whether loss reasons actually get logged, or whether "no decision" quietly swallows every deal nobody wants to explain in a team meeting. Win rate is the number most likely to expose whether the team's chasing the right deals in the first place, and catching a soft month here beats discovering a lost quarter in October.
Quota attainment: reading a team-level number at the rep level
Quota attainment is actual sales divided by quota, times 100, and the average isn't something anyone should print on a t-shirt. RepVue's Cloud Sales Index, built from roughly 47,000 quota-carrying reps across 246 cloud companies, put attainment at 42.69% in Q2 2025. CSO Insights and Salesforce's State of Sales research land closer to 45% to 50%, with top-quartile teams clearing 70%. That gap between median and top quartile is where the actual coaching work happens, week after week, rep by rep.
Xactly's 2025 Sales Compensation Report found 87% of B2B sales professionals struggling to hit quota. Spread across thousands of individual reps, that stops looking like bad luck and starts looking structural, the kind of number that should make a VP of Sales sit up rather than shrug it off as a talent problem. Highspot's State of Sales Enablement Report 2025 found teams coached with real-world scenarios were 23% more likely to improve attainment, which is about as clean a line as you'll find between a weekly coaching habit and a number that actually moves.
The trick in review is watching the slope, not the snapshot. A rep at 30% through week 10 of a 13-week quarter needs a completely different conversation than a rep at 70% in that same window, even though both look "behind" if you're only glancing at the raw number. One more wrinkle: Optifai's Sales Ops Benchmark found companies with 1 to 50 employees averaging 72% attainment against 58% for companies over 201 employees. Team size shapes what counts as a fair target, so benchmark against peers your size and let the industry-wide average sit this one out.
Pipeline coverage ratio: the earliest warning signal for forecast risk
Pipeline coverage ratio is total open opportunity value divided by quota target, and it's the number that warns you about a shortfall weeks before it shows up on a forecast call. Healthy range runs 3x to 5x, though transactional sales can get by around 2x to 3x, while enterprise needs 4x to 5x to absorb the slippage and lower win rates that come bundled with longer cycles and more people in every deal.
Quick math: a mid-sized quarterly quota wants three to five times that figure sitting open in pipeline. That cushion exists because stalls, per the stat above, are close to universal. Given current win rates and stretched-out cycles, plenty of teams now need the full 4x to 5x just to hit what used to pass for normal. The 3x floor that felt safe a few years back may not cut it anymore, and treating it like gospel is how forecasts quietly go soft.
Weekly matters here specifically because a ratio slipping below 3x mid-quarter needs a phone call today, not a bullet point in next month's business review. It means new pipeline has slowed, or deals are leaking out faster than fresh ones are replacing them. A manager holding win rate and pipeline value together in the same view can make a real call on the quarter. Skip it, and forecasting turns into guesswork with a spreadsheet attached to make it look official.
Sales velocity: the single number that ties pipeline health to revenue output
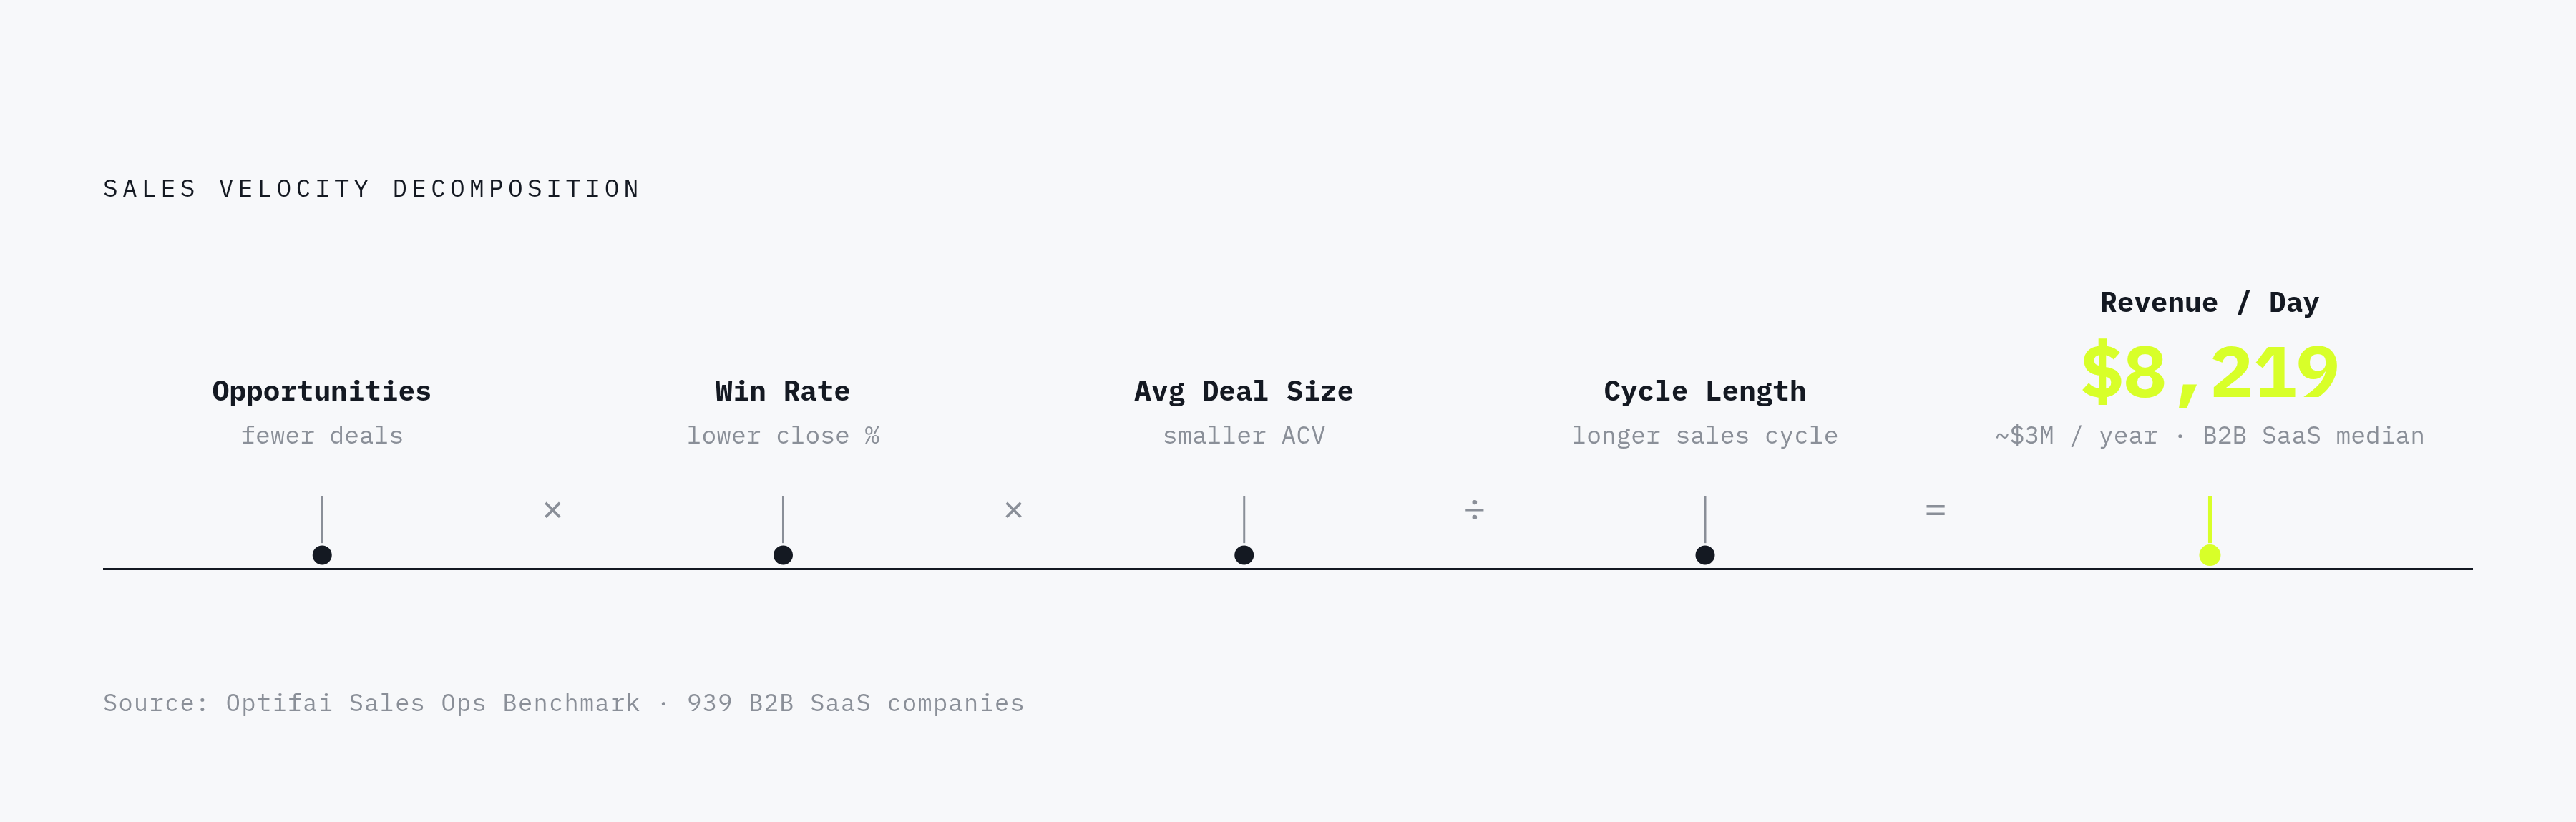
Sales velocity is the composite: number of opportunities, times win rate, times average deal size, divided by cycle length, and it nets out to revenue generated per day. Optifai's Sales Ops Benchmark, pulled from 939 companies across Q2 2025 through Q1 2026, puts B2B SaaS at roughly $8,219 a day, about $3 million annualized.
Revenue operations teams that do this well track velocity weekly, not quarterly, because it's the earliest composite signal that something in the pipeline has gone sideways. Drop two weeks running and that's a structural flag; the job becomes figuring out which of the four inputs is dragging the number down: fewer opportunities, a lower win rate, smaller deals, or a longer cycle. Each has its own fix, and velocity alone won't tell you which one it is, only where to start looking.
If a team could fight for only one metric to track every week, this is the one worth losing sleep over. It's the closest thing sales has to a single proxy for how fast money is actually moving through the pipe, and a reasonable target is meaningful improvement quarter over quarter. Anything flat for two quarters running deserves a longer conversation than a Monday standup allows.
Sales cycle length: where deals quietly die between pipeline reviews
Average B2B SaaS sales cycle length sits around 84 days, though that average hides a lot of spread underneath it. SMB deals tend to close faster than mid-market or enterprise equivalents, with cycle length rising alongside deal complexity and size. Gradient Works reported the broader B2B average stretching to 6.5 months in 2025, which tells you the long tail is doing real work on that overall figure.
Longer cycles quietly wreck forecast reliability in a way that's easy to underweight. A deal slipping from week 8 to week 16 doesn't just miss this quarter's number; it lands in next quarter's pipeline and distorts that forecast too, showing up as "new" business that was never actually new. The weekly job is straightforward: flag anything sitting past your team's typical cycle length, then find out where stakeholder access stalled or where a next step went undocumented three weeks ago without anyone raising a hand.
Common culprits worth checking: too many decision-makers with no internal champion actually pushing the deal forward, a mutual action plan that lives in someone's head instead of on paper, or qualification that mistook "interested" for "committed" back in week two. This loops back to the stakeholder math from earlier. With 6 to 10 people standard on a deal now and stalls near universal, cycle length looks less like a rep execution problem and more like a deal architecture problem, which is a much less satisfying thing to blame someone for in a one-on-one.
Stage-by-stage conversion rates: finding the leak in the pipeline before it drains
Stage conversion is the percentage of opportunities moving from one stage to the next, and reviewing it as one blended number tells you almost nothing. For orientation: lead-to-MQL and MQL-to-SQL conversion rates vary widely by segment and motion, and win rate among B2B sellers averaged 29% in 2024 according to Ebsta x Pavilion.
The weekly discipline is reading stage by stage, never funnel-wide. A drop at SQL-to-opportunity points at qualification. A drop at proposal-to-close points somewhere else entirely: pricing, maybe, or procurement, or a competitor who showed up late and stole the deal at the last stage. Worth splitting by deal type too, since new business, upsell, and renewal convert at genuinely different rates, and blending them together hides exactly which motion is underperforming.
How do you tell a real problem from ordinary week-to-week wobble? If a specific stage's conversion drops for two weeks running, that's a pattern, not noise, and that's the trigger for a coaching conversation, or a hard look at ICP fit, before the quarter's numbers make the decision for you instead.
Activity metrics: how to use them without letting them become vanity tracking
Research consistently finds reps spend a minority of their week actually selling, with the rest disappearing into admin, internal meetings, and CRM data entry that nobody on this earth enjoys doing. So when you track activity (calls made, emails sent, meetings booked) you're measuring a sliver of the week, and that sliver only means anything once you set it next to conversion.
Dial-to-meeting conversion rates are typically low across the industry. A rep making many dials a week at a very low conversion rate has a completely different problem than a rep making fewer dials at a meaningfully higher rate. Raw volume alone can't tell you which one needs coaching and which one just needs a bigger list. Most deals require multiple touchpoints before they close, so weekly activity tracking is really asking one question underneath all the noise: are reps giving up too early?
Response time earns its own line here, separate from everything else. Research consistently shows that responding to an inbound lead within the first few minutes dramatically boosts conversion, and the gap between fast and slow response compounds quickly. Track that one weekly, on its own, without folding it into an average that buries it.
What keeps activity honest is pairing volume against conversion every single time. If calls are up but conversion is flat, the problem is probably targeting or messaging, not effort. That distinction is the difference between a coaching conversation that actually helps and one that just makes a rep feel bad for no reason.
Building the weekly metrics review into a repeatable management habit
Run these roughly in the order they've come up. Start with pipeline coverage: is there enough in the funnel to hit the number at all? Then velocity, to see whether it's moving fast enough through the stages, followed by win rate and cycle length together, to find where things are actually breaking. Then stage-by-stage conversion, to pin down exactly which step is leaking, and activity paired against conversion, to check whether reps are working the right deals the right way. Finish with quota attainment trajectory, and decide who needs a conversation this week instead of a note filed for next month.
A good weekly review produces three things and then stops: one pipeline risk to chase this week, one coaching conversation to schedule, one forecast assumption to revise. But what happens when the CRM underneath all this is stale or half-filled-in? Pipeline coverage and velocity are only as good as the deal stages feeding them, so the review habit and CRM hygiene have to reinforce each other. Skipping that part turns the whole exercise into precise-looking nonsense dressed up with a dashboard.
Managers who run this review themselves, instead of skimming a deck someone in RevOps built for them, tend to build faster pattern recognition over time. They stop getting ambushed at quarter-end because they spotted the wobble back in week 6, not week 12, and this holds across enough teams that it stops feeling like a coincidence.
Teams landing at 70% attainment or better — a threshold associated with top-quartile performance — typically share one habit: they review these numbers weekly rather than waiting for the quarter to deliver its verdict.ly aren't looking at different numbers than everyone else. They're looking at the same ones, faster, with a shorter gap between noticing a wobble and doing something about it. That gap, more than any single metric on this list, is the whole game.