Sales KPI Examples for Individual Contributor and Manager Scorecards
Different roles need different metrics—reps own activities, managers own systems.

Most sales scorecards fail for a boring reason: they measure managers and reps on the same metrics, as if a rep's win rate and a manager's win rate mean the same thing. They don't. One measures a person's behavior, the other measures a system that person is supposed to be running, and mixing the two up is why so many scorecards get quietly ignored by month three, sitting in some shared drive that nobody opens except during comp disputes.
Per Ebsta's 2025 GTM Benchmarks, 78% of sellers missed quota last year. Salesforce's State of Sales for 2024-25 found only 28% of reps hit annual quota, the lowest mark in six years. Numbers that bad, across an entire industry, raise a question that's less about why reps are underperforming and more about whether anyone built the scorecard to measure the right thing for the right person in the first place. So that's what this piece does, role by role: what belongs on an SDR's card, what changes when the motion goes fully outbound, what a closer should own, and what stays locked to a manager's desk, never trickling down into an individual's review.
How to read a sales scorecard: leading vs. lagging, activity vs. outcome
Every metric on a scorecard falls into one of two buckets. Leading indicators, like pipeline coverage, conversion rate, and cycle length, are things a rep or manager can still act on today. Lagging indicators, like win rate, revenue, and retention, are what those earlier actions eventually add up to. A scorecard built only on lagging metrics tells you the deal already died last quarter. A scorecard with both tells you it's dying right now, while there's still time to save it.
Break it down further and you get three layers: activities, indicators, results. Activities are calls, emails, meetings booked (the stuff a rep controls minute to minute). Indicators are cycle length and pipeline velocity, signals that point somewhere without being fully in anyone's hands alone. Results are bookings, ARR, win rate, the numbers that end up on a board slide whether the rep likes it or not. Individual contributors live mostly in the activity layer and lean into indicators; managers own indicators and results at the team level, along with the coaching work that decides whether IC activity was ever any good to begin with.
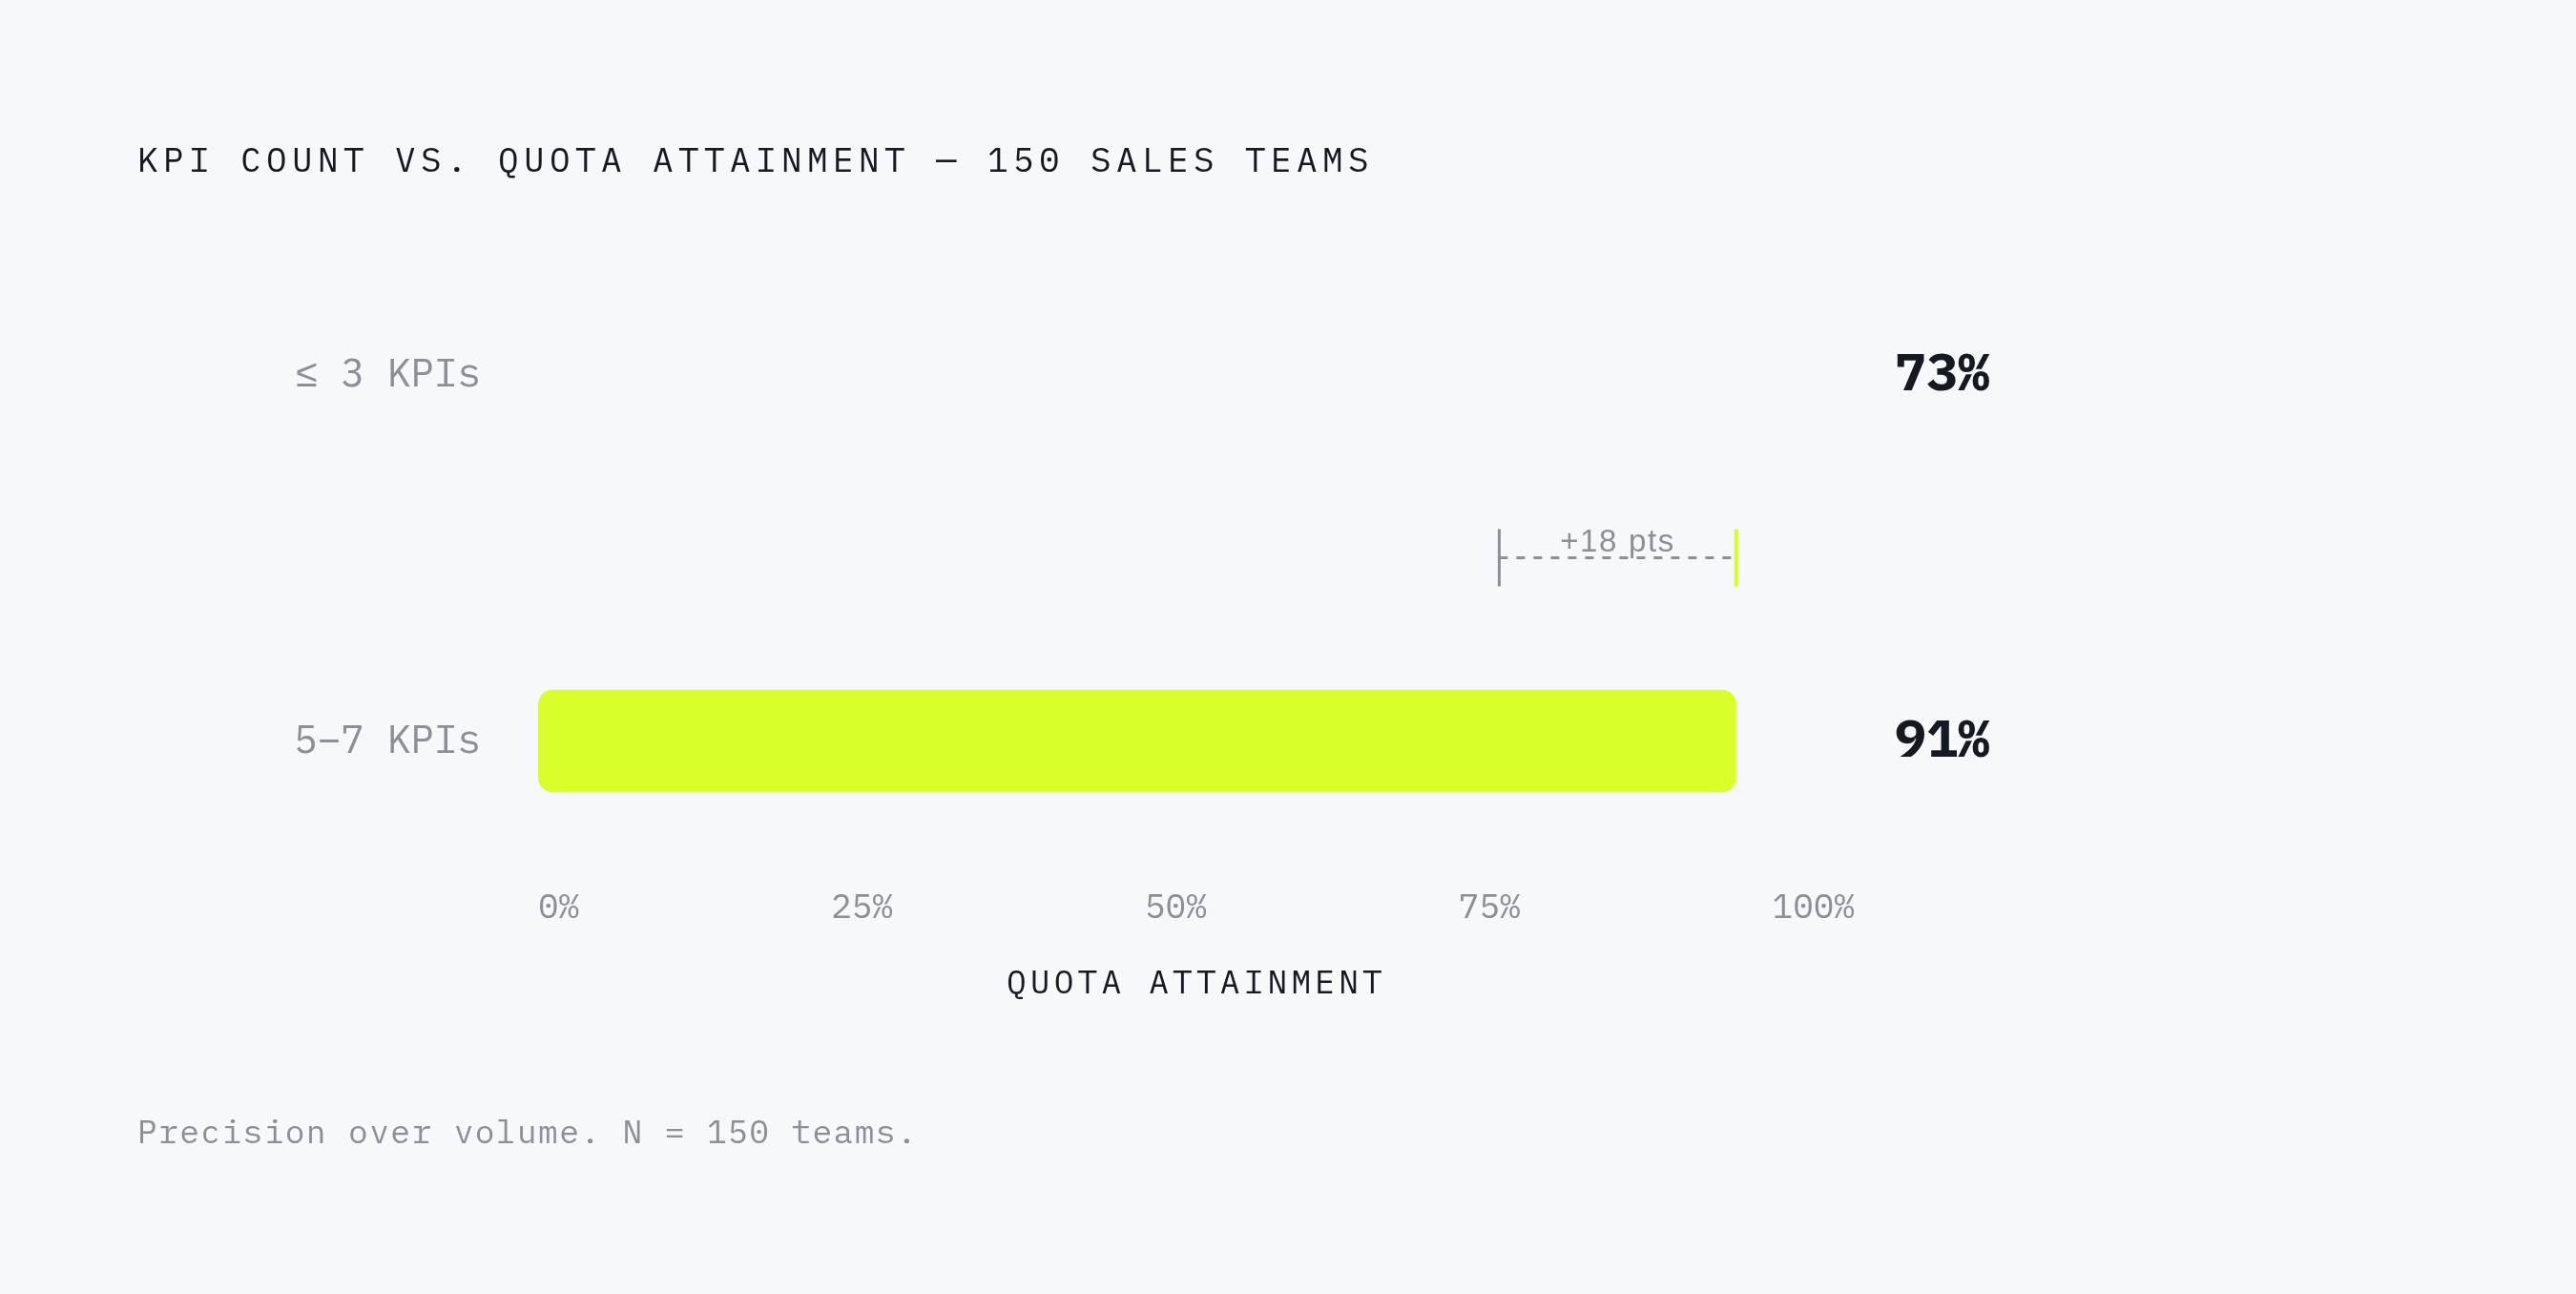
How many metrics belong on one card? Five to seven, according to most practitioners, and there's a number behind that cap: Optifai looked at 150 sales teams and found the ones tracking five to seven core KPIs hit 91% average quota attainment, versus 73% for teams tracking three or fewer. Eighteen points is a real gap, and it has less to do with effort than with whether the scorecard points at anything specific enough to act on. Every section below sticks to that cap, organized by role.
SDR scorecard: the metrics that belong on an inbound qualifier's card
An SDR's job, stripped to one sentence, is to qualify inbound leads and hand qualified meetings to an AE. Every metric on this card should trace back to that handoff, or it doesn't belong there.
Speed-to-lead comes first. MIT research found reps are roughly 100 times more likely to connect with a lead when they call within five minutes, versus waiting 30. The gap between a live conversation and a voicemail nobody calls back is why response time needs to sit on the card as a hard number in minutes, not as a soft "respond promptly" bullet that means nothing to anyone.
Meetings booked is the obvious next line. Across a sample of 847 SDRs at 156 companies, the median SDR produced roughly 8 to 10 qualified meetings a month, with top-quartile reps climbing into the low-to-mid teens. That range gives a manager something real to set a target against instead of pulling a number from the air and hoping it holds.
MQL-to-SQL conversion rate matters too, and it doubles as a mirror held up to the whole org. Teams with aligned lead definitions and shared CRM dashboards convert north of 30% of MQLs to SQLs; siloed teams, where marketing and sales can't agree on what "qualified" even means, sit closer to 13%. If an SDR's number looks bad, check the definition before you assume the rep is the problem.
Meeting-to-opportunity rate earns its spot for a comp-design reason: pay SDRs on this instead of raw meetings booked, and they stop stuffing AE calendars with meetings that go nowhere. It aligns the incentive with what actually happens after the handoff.
SDR attainment averages around 88% industry-wide. This role gets measured almost entirely on things the rep actually controls. Keep the card activity-heavy, keep it leaning on leading indicators, and resist the itch to bolt on a closed-revenue metric the SDR has no real hand in influencing.
One more line worth including: CRM hygiene and handoff notes. A meeting that lands on an AE's calendar with zero context, no notes on what the prospect actually cares about, is half a job. Give it partial credit and no more.
BDR scorecard: what changes when the motion is entirely outbound
Take away the inbound queue and the job changes shape entirely. A BDR's day runs on research, sequencing, and personalization across cold channels, so activity discipline and message quality become the two levers that actually matter. There's no warm lead sitting in an inbox waiting to be worked here.
The Digital Bloom's 2025 numbers put daily activity volume around 94 total touches: about 36 calls, 33 emails, 15 voicemails, 7 social touches. Treat that as a floor, not a ceiling. Cranking volume up without touching quality just means more noise landing in more inboxes that get deleted faster than they arrived.
Cold email reply rates run 3% to 8% depending on how deep the personalization goes, and top performers push past 8% through account-level research rather than generic templates. That's the whole case for tracking reply rate as a quality metric rather than a quantity one. A BDR firing off 200 generic emails a week can look busy on a dashboard and still get outperformed by someone sending 80 tailored ones.
Call-to-meeting conversion sits at a fairly grim 2% to 3% of cold calls, per multiple 2024-2025 studies. That number alone justifies tracking list quality and messaging effectiveness alongside raw call counts. If 97% of calls go nowhere, the fix has more to do with dialing smarter lists and sharper openers than dialing harder.
Messaging effectiveness is itself trackable. Timeline-hook messaging (something like "companies your size usually see X within 90 days") drives roughly 10% reply rates, versus about 4% for problem-statement hooks ("are you struggling with X?"). More than double, just from reframing the ask. A/B testing message frameworks belongs on the scorecard itself, not buried in some training deck nobody's opened since onboarding.
Pipeline sourced in dollars and accounts engaged round things out, connecting the top-of-funnel grind to the pipeline an AE eventually inherits. On weighting: activity metrics should carry the majority of a BDR's total score. Heavier weight toward results only makes sense once a rep controls deal quality and not just door-knocking volume, which is exactly the line that separates this card from the next one.
AE scorecard: the metrics that belong on a closer's card
Flip the BDR weighting on its head. AE scorecards should run 60% to 70% on results (quota attainment, win rate, revenue), because AEs control the close and the deal quality, not just the volume of outreach that started things off.
Quota attainment for revenue closers averaged 58% to 59% in 2025, though that top-line figure hides plenty. Enterprise AEs hit only 38.2%, mid-market AEs land at 40.1%, both dragged down by deal complexity and longer cycles. Set attainment targets by segment. A single org-wide figure means something different depending on whose desk it lands on.
Win rate tells a similar story. The 2024 industry average sat at 21%, with Ebsta's 2025 benchmarks putting mid-market specifically at 21.2%. Top performers run meaningfully above the average, which turns win rate into a genuine coaching signal instead of just a number read aloud in a QBR and forgotten by lunch.
Sales cycle length is worth tracking at the individual level too. B2B Sales Benchmarks 2024 put the average mid-market sales cycle at 6.2 months, with enterprise deals stretching 7 to 9 months depending on deal size. An AE who checks their own cycle length against the team median can catch a stalling pattern in their own pipeline before a manager has to point it out in a 1:1.
Pipeline coverage follows a simple rule: 3x quota at minimum, push to 4x or 5x if win rate is running below average. That turns coverage into an early-warning system instead of a backward-looking number nobody checks until it's too late.
New versus expansion revenue split deserves its own line, especially now. Expansion revenue has become an increasingly significant share of total new revenue, a trend reflected in Ebsta and Pavilion's joint benchmarks. An AE sitting on accounts with real expansion potential needs that ratio spelled out on the card, or they'll default to hunting new logos and leave upsell money on the table, mostly because nobody bothered to tell them it counted toward the number.
Average deal size and CRM hygiene, meaning pipeline stage accuracy and timely follow-up logging, round out the card. Hygiene metrics are the tell for whether a rep is running the actual playbook or improvising something that just looks similar from a distance.
Sales manager scorecard: the team-level metrics ICs should never own
Same label, different job. When a manager's scorecard shows "win rate," that's a team aggregate and a coaching diagnostic. When an AE's scorecard shows "win rate," it's a personal performance measure. Mixing those two readings is exactly the mismatch this whole piece opened with.
Some metrics belong exclusively at the manager level: forecast accuracy, quota attainment distribution across the whole team (the spread, not just the average), rep ramp time, pipeline coverage by territory, coaching activity measured against rep improvement over time.
Forecast accuracy is the cleanest case for why this sits with the manager alone. If a manager can't forecast within a reasonable band, there are only two real explanations: the pipeline data is dirty (a process problem), or deal qualification is inconsistent across the team (a coaching problem). Either way, that's the manager's desk, not a rep's.
Then there's the number that should make any VP of Sales sit up: Ebsta and Pavilion's 2025 GTM Benchmarks found 14% of sellers drive 80% of revenue, an 11x gap between top and bottom quartile. That's an individual performance story, but a gap that wide is a manager accountability issue too, which is exactly why attainment distribution, not attainment average, needs its own line on the manager's card. Averages hide this. Distributions expose it.
Coaching metrics close the loop. Track coaching sessions, call reviews, and deal reviews per rep per month, then correlate that against rep-level improvement, and you've tied a manager's inputs directly to their team's outputs. McKinsey found companies running systematic, data-driven sales management see EBITDA gains of 15% to 25%. That's the business case for holding managers accountable to team-system metrics, rather than handing them a revenue number and walking away.
Review cadence belongs on this card too. Weekly checks on activity metrics, monthly reviews of win rate and deal size trends, quarterly looks at strategic indicators, layered together rather than left to whenever someone remembers to open the dashboard. Discipline about when you look at a number is itself a manager-level KPI, and it's one that's easy to overlook and easy to get backwards.
Putting role-split scorecards into practice without rebuilding your CRM
None of this requires new software or a rebuilt dashboard. It requires discipline about which five to seven metrics go on which card, and the nerve to leave the rest off, even when someone in a QBR insists their favorite metric deserves a spot.
Pick the metrics that connect most directly to each role's actual job. Sequence them from leading to lagging so people can see trouble coming before it shows up in a revenue number. And resist the urge to bolt on an eighth or ninth metric before the first five are actually working. Role-split scorecards also fall apart fast if marketing and sales haven't agreed on lead definitions before SDR and BDR targets get set. That misalignment is most of what separates the 30%-plus MQL-to-SQL conversion of aligned teams from the roughly 13% at siloed ones.
Weighting is a design choice, not an afterthought. Build the BDR's 50-to-60% activity weighting and the AE's 60-to-70% results weighting straight into the template, so reps see, in black and white, what the org actually prioritizes instead of piecing it together from vague comments in a review.
Cadence matters as much as metric selection does. The Sales Management Association found in 2024 that teams tracking and reviewing the right KPIs consistently saw 28% higher quota attainment than teams that didn't. Picking the right five metrics and then only glancing at them once a quarter undoes most of the benefit.
Worth naming here too: strategy-first content (battle cards, objection-handling guides, outbound sequence frameworks keyed to the messaging benchmarks above) can move reply-rate and win-rate numbers that reps genuinely struggle to shift on their own. That's where a marketing investment pays a traceable dividend on the sales scorecard, assuming someone's actually coordinating it. Getting that content built and tracked across distributed sales and marketing teams, so you can see which battle card actually moved a reply rate instead of just guessing, is real ongoing work. Letterstory is one tool built to take that work off someone's plate, so a rep isn't reverse-engineering a spreadsheet just to answer a question that should've had an answer already.
One last point. A scorecard isn't a permanent document, and treating it like one is how you end up measuring a business that no longer exists. As deal complexity shifts, or as expansion revenue grows into a bigger share of the business than new-logo hunting, the new-versus-expansion split needs rebalancing, and both IC and manager targets have to move with it. Put a quarterly trigger on the calendar, just a recurring reminder to check whether the scorecard still matches the business it's measuring. The one thing worse than no scorecard is one everybody's quietly stopped believing in.