Onboarding Ramp Time Benchmarks by Sales Role
Product complexity and manager bandwidth have stretched new rep onboarding to historic lengths.

The average AE ramp time increased 32% between 2020 and 2025, climbing from 4.3 months to 5.7 months, according to Bridge Group's 2024 data. Five years. One consistent direction. That is not noise.
Three forces are driving it, and none of them are reversing. The first is product complexity. The average B2B software product today carries more features, integrations, and use cases than it did five years ago, and a new rep has to develop genuine command of that surface area before they can hold a credible conversation with a buyer who has already done their research. Buyers now arrive at first meetings having consumed substantial due diligence, and they dismiss underprepared reps quickly. A rep who read as competent in 2019 reads as a waste of time in 2025. The second is manager bandwidth. As sales teams have scaled, manager-to-rep ratios have expanded at many organizations, reducing both the frequency and the quality of individualized coaching during the ramp window. Less coaching means slower ramps. That relationship is about as close to a law as sales operations gets.
The practical implication is blunt: if your ramp assumptions were built before 2022 and have not been revisited, they are actively understating the time your reps actually need. Benchmarks from 2019 or 2020 are not conservative estimates. They are planning errors — like using a 2019 map to navigate a city that has been under construction ever since.
SDR and BDR Ramp: The Fastest of the Four Roles, but With Real Variance
The median SDR ramp to 80% of booked-meeting quota is 3.2 months, with a range of two to five months depending on environment and support infrastructure, per Bridge Group's 2024 data. Fastest of the four major sales roles, and the reason is structural. SDR work is more process-bound than closing work. A well-defined outbound cadence, a qualified target list, consistent call coaching, and proven messaging sequences compress the learning curve substantially. The rep does not need to master a full commercial negotiation or a multi-stakeholder buying process. They need to get good at generating interest, and that skill has a shorter feedback loop than any closing motion.
The single biggest driver of variance at this level is whether a rep arrives with proven sequences on day one or is expected to construct their own outreach from scratch. Hand new SDRs a tested playbook immediately and ramp times trend toward the low end. Ask them to build their own materials and you have extended that window considerably, because the rep is now solving two problems at once: learning the job and figuring out what to say while doing it. High-velocity verticals like freight brokerage and financial services, when structured practice programs are in place, can reach functional productivity in six to eight weeks. That is not exceptional; it is what happens when the inputs are right.
The part most headcount plans quietly omit: average SDR tenure runs 14 to 16 months, per Bridge Group's 2024 data. Subtract the ramp period from total tenure and the window of peak productive output is narrower than the raw math implies. A rep who takes three months to ramp and leaves at 15 months has contributed roughly a year of productive output, possibly less. Apply that across a team running 40 to 50% annual turnover in SDR roles and you have a capacity problem that is hiding in plain sight — like a leak behind the drywall that only shows up when you finally check the water bill.
SMB and Mid-Market AE Ramp: How Deal Cycle Length Sets the Clock
SMB AEs ramp fastest among closing roles, typically reaching 80% of quota in three to four months on short deal cycles, per Bridge Group's 2024 data. The mechanism is repetition. When a rep can run multiple deals to close within the first 60 days, they accumulate enough feedback to identify their own gaps and adjust in real time. Short cycles are a training infrastructure by themselves.
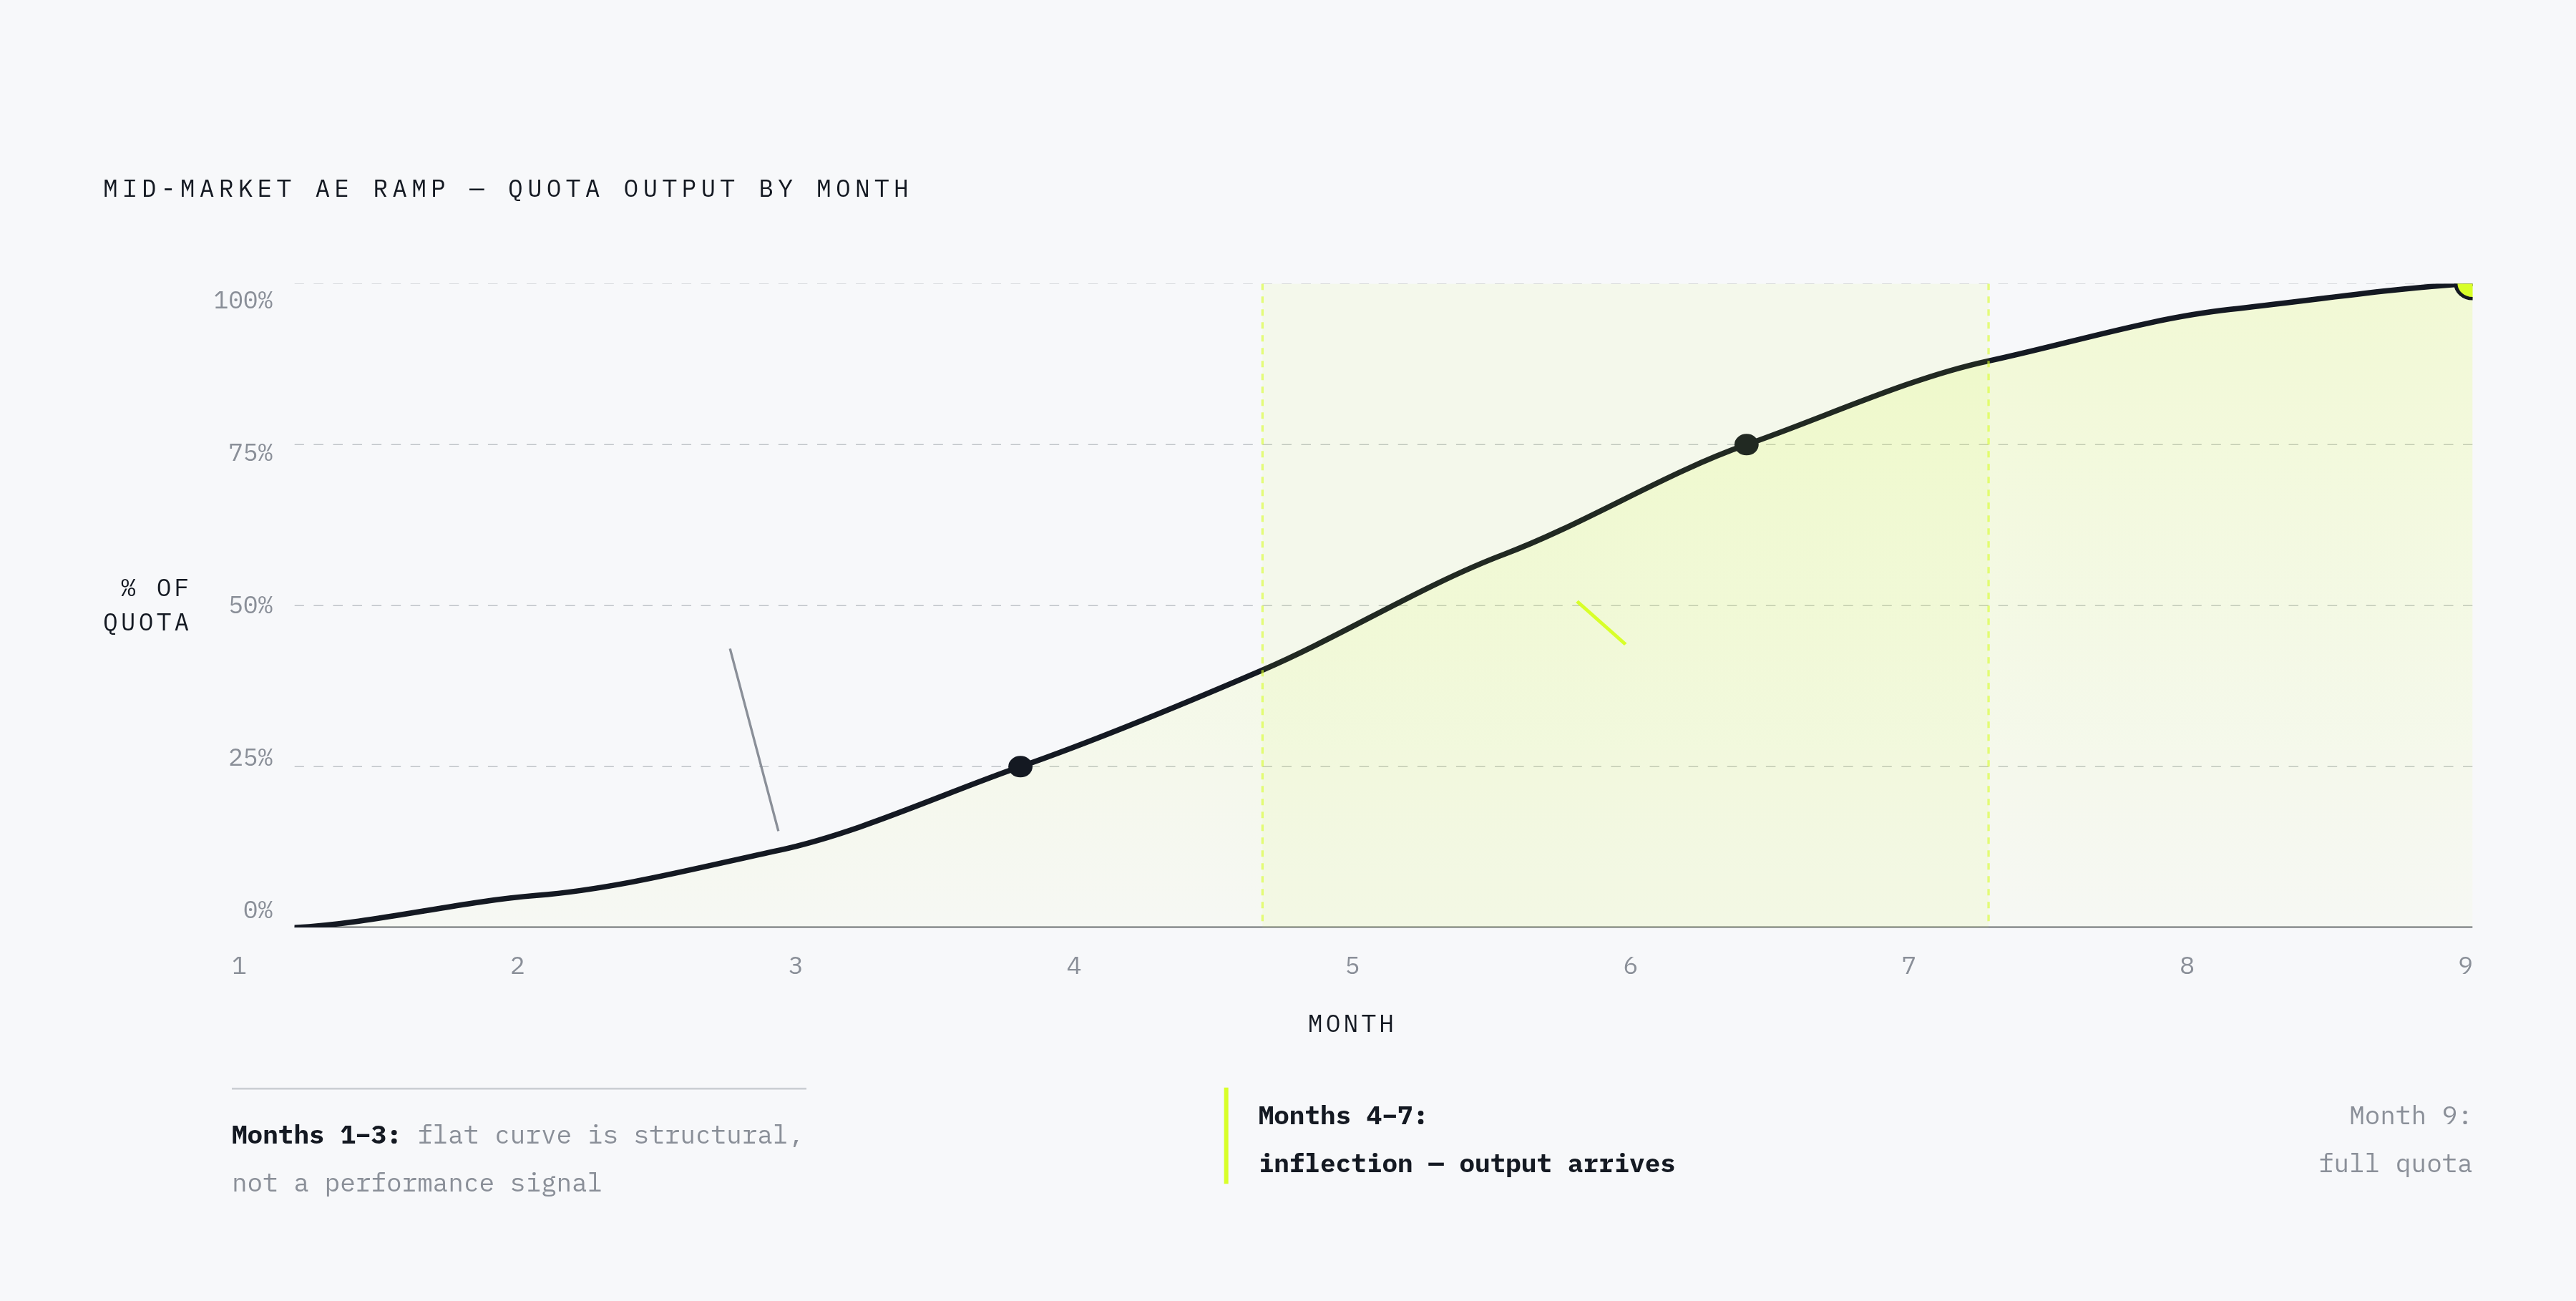
Mid-market AEs operate on a longer clock: four to six months as a standard benchmark, with a productivity curve that runs approximately 25% of expected output by month three, 75% by month six, and full contribution arriving closer to month nine. That S-curve dynamic matters more than most leaders account for, because it shapes how early-tenure pipeline reports should be read. Months one through three produce little closed revenue not because the rep is failing but because pipeline is still accumulating. The output inflection comes between months four and seven. Leaders who misread that flat early curve as a performance problem intervene in ways that destabilize a rep who is actually on track. That is one of the more common and avoidable mistakes I have seen organizations make at scale.
A useful internal check: ramp time for any AE role approximates the average deal cycle for that role plus 90 days. If your mid-market deal cycle runs 90 days, plan for a five-to-six month ramp. If it runs 120 days, plan for six to seven. Not a substitute for role-level benchmarks, but a reliable sanity check.
The blended AE average across all segments sits at 5.7 months, per Bridge Group's 2024 data, and that number is pulled heavily upward by enterprise roles. Using it as a universal benchmark produces quotas that are too aggressive for enterprise reps and too conservative for SMB ones. Both errors are expensive in different ways.
Enterprise AE Ramp: Why the 9 to 12 Month Window Is Structural, Not a Coaching Problem
The median enterprise AE ramp to baseline quota performance is seven to nine months, per Gartner's 2024 data. Bridge Group's 2024 SaaS benchmark adds sharper texture: enterprise AEs take an average of 5.3 months to close their first deal, and 12 to 18 months to consistently hit full quota. These numbers are reflections of the deal structure, not verdicts on rep capability.
A capable enterprise rep can execute everything correctly and still not close their first deal until month five or six. Multiple stakeholders, procurement reviews, legal cycles, executive sign-off sequences: none of that compresses because the rep is talented. The rep's pace is not the constraint. The structure of the sale is. Organizations that miss this distinction build quota schedules that penalize reps for dynamics that were never within their control, and then they lose those reps.
The primary drivers of variance at the enterprise level are depth of product knowledge, the rep's ability to orchestrate multi-stakeholder deals, and access to strong presales or technical support. A rep who has all three has a genuine path to the low end of the range. A rep building all of that without support will arrive at the high end, if they arrive at all.
Quota ramp schedules for enterprise roles should be built to reflect this directly. Common models set quota at 50 to 75% of full expectation through months four to six, then delay full quota to month seven or later. Quotapath's 2025 data found that six months was the most commonly stated ramp period across companies surveyed. That figure understates the enterprise reality by a meaningful margin, and it signals that many organizations are building expectations the job structurally cannot support in that time frame. You cannot rush a glacier by scheduling it more aggressively.
How Industry Vertical Shifts the Benchmarks for Every Role
Role is one axis. Vertical is a separate multiplier, and conflating them is a planning error you will feel for years. A mid-market AE in B2B SaaS and a mid-market AE in MedTech carry the same title and similar quota structures. They operate on fundamentally different ramp clocks.
MedTech and healthcare represent some of the longest ramp timelines in any vertical. Reps in these environments need not just product knowledge but genuine fluency in buyer language, clinical workflow, and procurement processes that vary by institution. Deal cycles commonly run 12 to 24 months, per industry sales cycle data. That means a single target account enters a buying cycle once within a multi-year window. Miss a rep's ramp in that environment and you have not lost a quarter. You have lost a cycle.
Manufacturing carries a 124-day average sales cycle and a 19% win rate, per Salesforce's 2024 State of Sales data. Both figures extend the effective ramp window well past generic role benchmarks. Complex procurement structures and multi-stakeholder approval chains mean that even technically proficient reps need sustained time in market before their pipeline reaches the density required for consistent attainment.
High-velocity verticals tell the other side. Freight brokerage and financial services, with structured programs in place, consistently beat median ramp times across SDR roles. Short feedback loops and high activity volume accelerate skill acquisition in ways that longer-cycle environments simply cannot replicate. That is not a character judgment on those verticals; it is physics.
The practical application is layering. Take the role benchmark as a baseline, then apply your vertical's average deal cycle as a modifier on top of it. A mid-market AE in manufacturing is not a mid-market AE running a four-month SaaS cycle with a different product. They are different planning inputs entirely, and treating them as equivalent produces quota schedules that are wrong before the rep's first day.
What It Costs to Get the Ramp Wrong, in Dollars and Pipeline
Replacing one mid-market sales rep carries an estimated total cost in the range of $215,500 to $292,000, including recruiting, onboarding, the productivity gap during ramp, pipeline loss during vacancy, and manager time. The productivity gap is by far the largest line item, which is why ramp duration is the primary lever worth managing. Compressing ramp time by one month on a role carrying significant productivity loss during that window is not a marginal improvement. It is a material financial result.
Annual sales rep turnover runs at roughly 35% across all roles, per Bridge Group's 2024 data, with SDR and BDR turnover running higher at 40 to 50%. In organizations running high-volume SDR programs, the aggregate cost of ramp inefficiency across a year's worth of new hires is a significant and largely untracked liability sitting inside the operating plan. Nobody puts it on a slide, but it shows up in the number eventually.
Poor onboarding makes the cost structure recursive. A meaningful share of new sales hires leave within the first 90 days, and the most commonly cited reason is poor onboarding, per Gallup's 2023 employee onboarding research. When that happens, the organization absorbs the full recruiting and early-ramp investment with zero productive output to offset it, then begins accruing the same costs again on a replacement hire. By the time this pattern surfaces as a missed board number, the root cause is almost never correctly identified. It gets called a pipeline problem or a territory problem. It is an onboarding problem.
What Structured Onboarding Actually Does to Ramp Time, by the Evidence
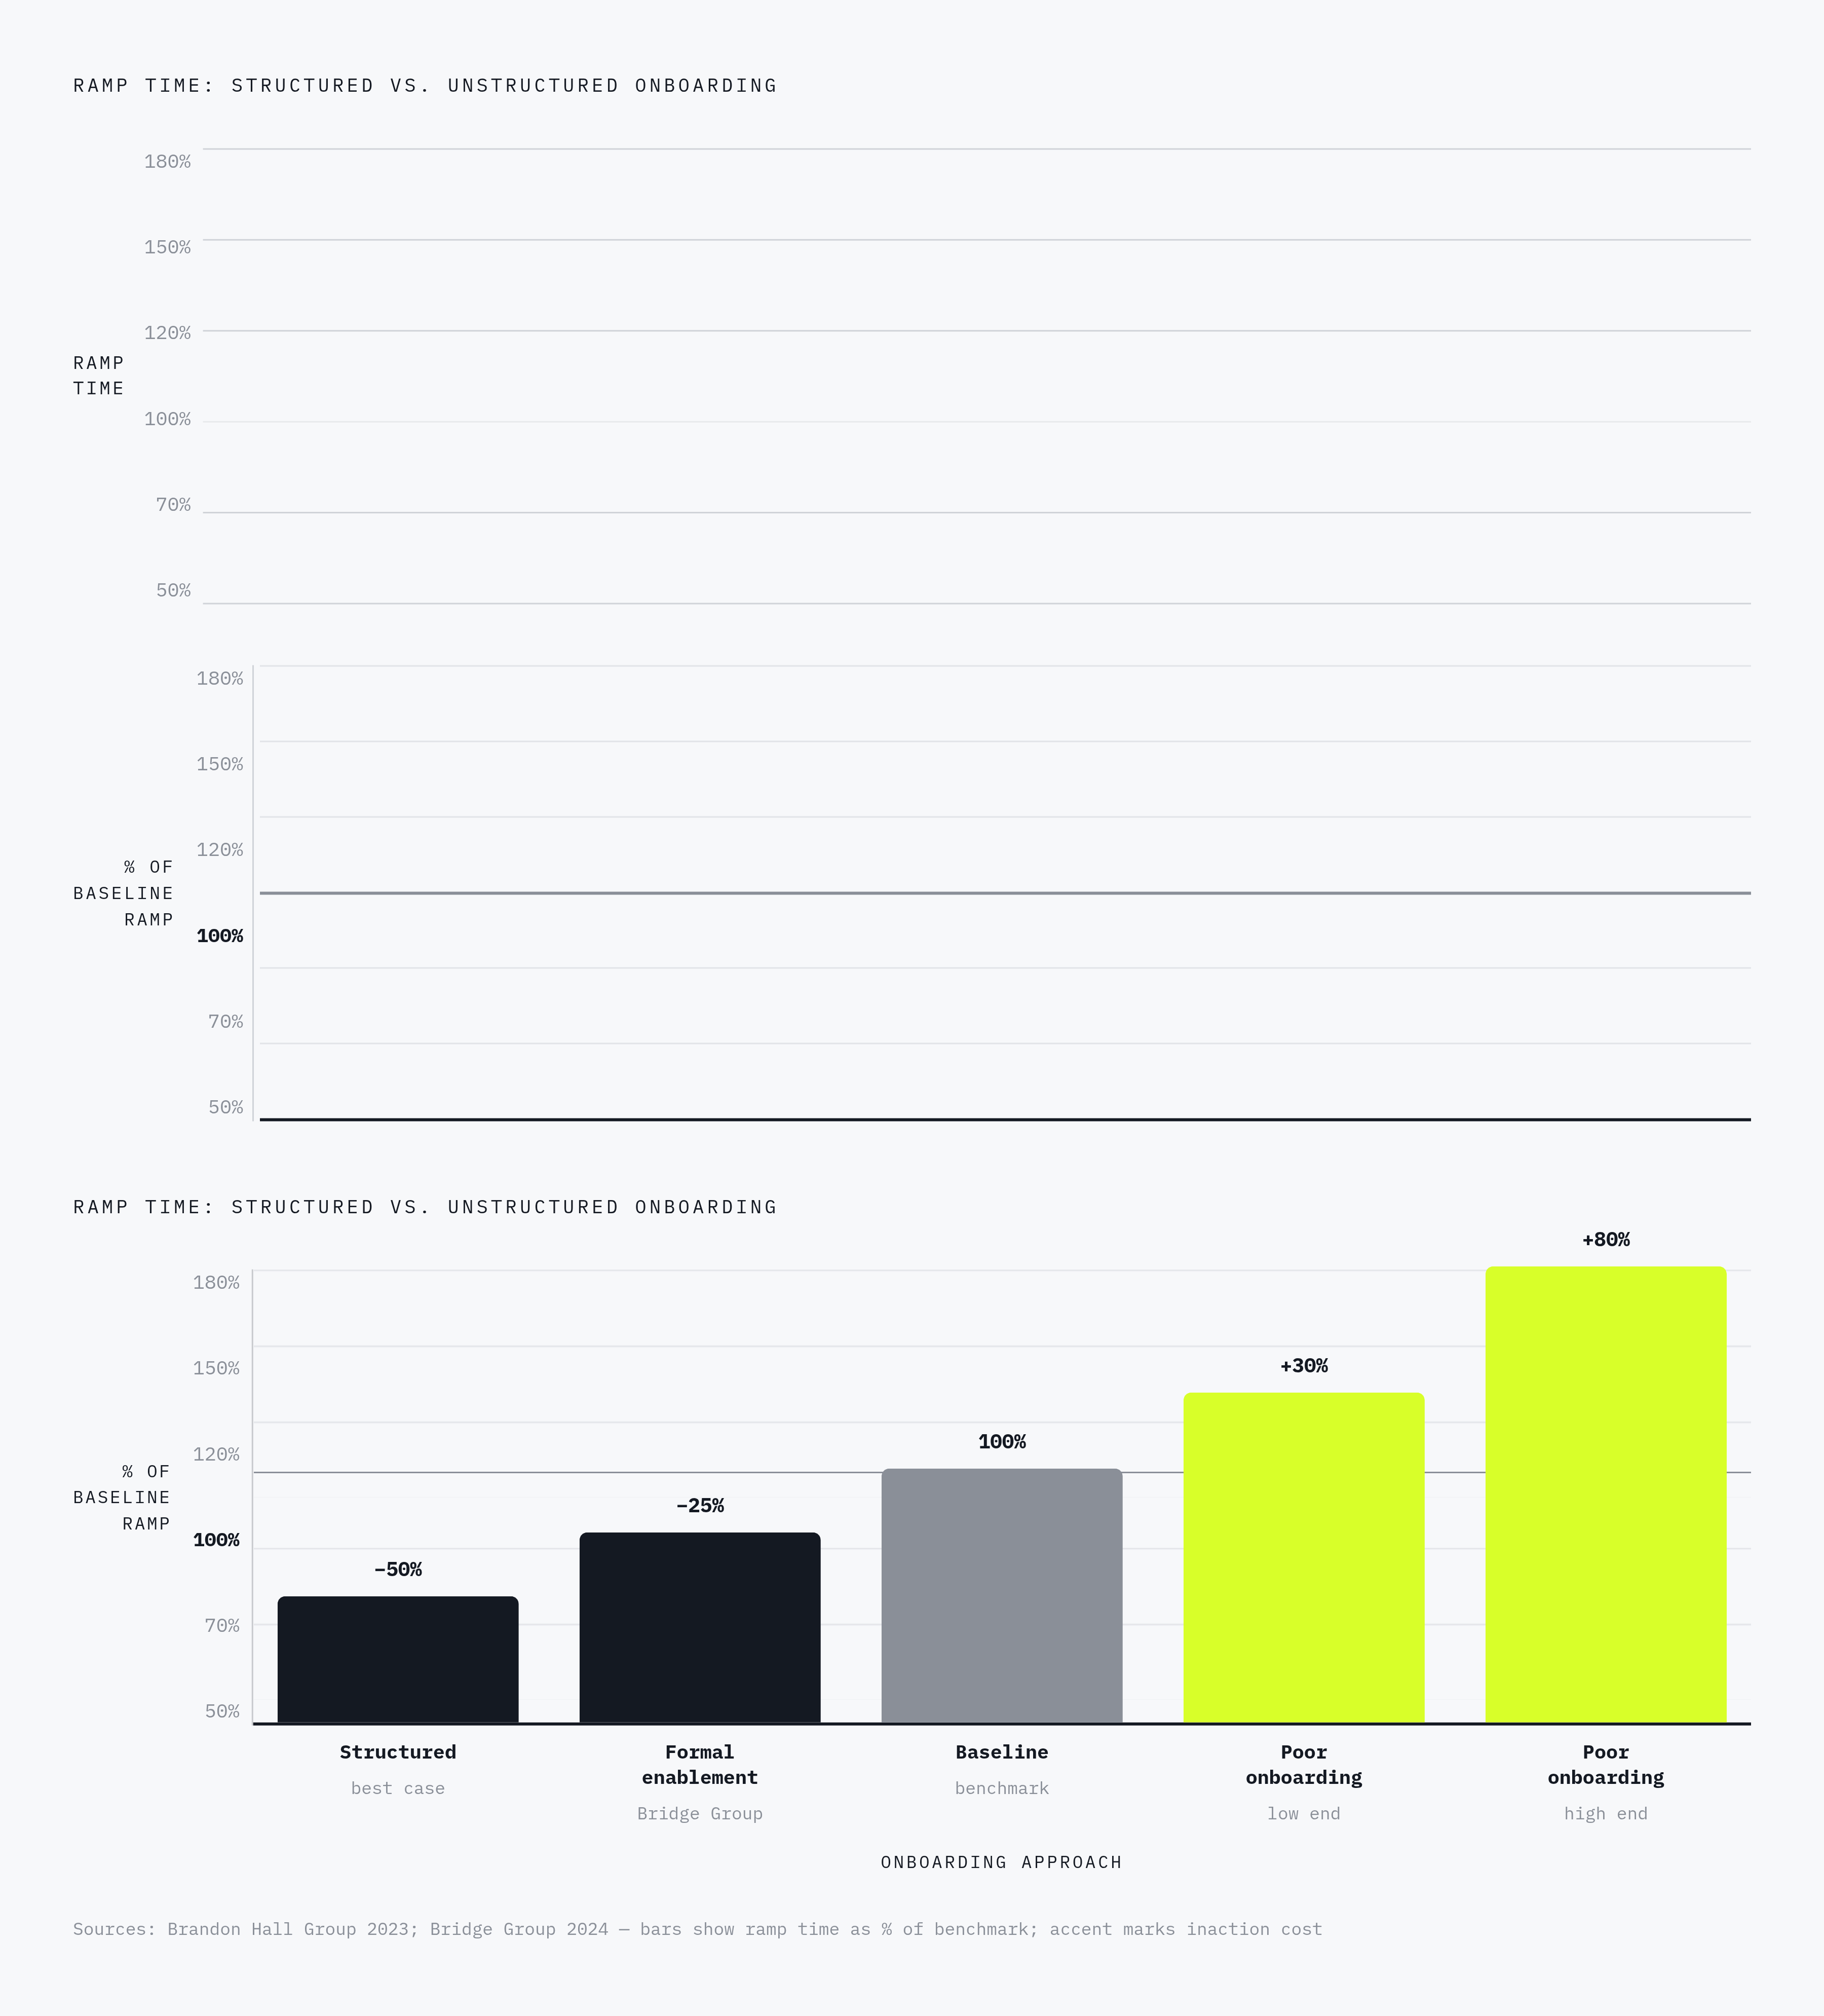
Brandon Hall Group's 2023 research found that structured onboarding reduces time-to-productivity by 30 to 50% compared to unstructured approaches. Bridge Group's 2024 benchmark adds that companies with formal sales enablement programs see 25% faster ramp-up and 15% higher first-year quota attainment. The magnitude of those gaps is consistent across the research base, and it is too large to attribute to variance in rep quality.
The word "structured" gets applied to things that do not qualify, so it is worth being precise. Structured onboarding means defined milestones per role, not a generic calendar that counts days. It means skills reinforcement that extends beyond the first week, not a product knowledge curriculum that front-loads all the information and then releases the rep into live pipeline without scaffolding. It means deliberate practice before reps are in front of real buyers, so that the first prospecting call is not also the first time the rep has attempted the pitch in any form.
The reinforcement problem is cognitive, not motivational. Research building on Ebbinghaus's forgetting curve indicates that people lose a substantial share of newly learned material without active reinforcement spaced across time. A one-time onboarding event, regardless of how well-designed it is, underperforms a program that spaces practice and feedback across the full ramp period. This will not improve with a more motivating kickoff deck.
The gap between best and worst practice is not close. Poor onboarding, stale CRM data, and the absence of a structured pre-call preparation system can add 30 to 80% to benchmark ramp times, per Brandon Hall Group's 2023 data. Only a minority of sales organizations have a structured methodology for developing selling skills during onboarding, per Gartner's 2025 data. The majority of organizations are leaving the single most impactful lever available to them entirely unused — which, to borrow from Ebbinghaus, is a lesson most of them will have forgotten by next quarter.
How to Apply These Benchmarks to a Headcount Plan Without Overfitting Them
Start with role and vertical before selecting a benchmark. A single blended ramp figure applied uniformly produces incorrect quota schedules for most of the team. That is not a hypothetical risk; it is the standard outcome when leaders reach for an industry average and apply it without modification.
From there, modify deliberately. Use the role benchmark as a floor, then apply vertical and product-complexity adjustments on top. An enterprise AE selling into regulated healthcare does not match a generic seven-to-nine month enterprise figure; that number needs to move upward to reflect deal cycle realities. A mid-market AE in a high-velocity SaaS environment with a narrow product and a short buying process can come in below the standard benchmark. Both are true at the same time, which is why the blended average is nearly useless as a planning input.
Build quota schedules that reflect what you actually know. The S-curve productivity pattern for mid-market AEs and the extended back-end ramp for enterprise roles should be explicitly embedded in quota ramp schedules, not just held as informal planning assumptions in a spreadsheet nobody opens after close. If a mid-market AE is expected to contribute 25% output by month three and 75% by month six, the quota assigned in month three should reflect that. Assigning full quota at month two to tighten the schedule on paper does not compress the actual ramp. It creates a rep who is perpetually behind a number they were structurally never going to hit, and that becomes a retention problem before it becomes a performance conversation.
Finally, calibrate annually. Measure actual ramp distribution within the team against the benchmark every year. Ramp times shift as product complexity increases, buyer sophistication compounds, and manager bandwidth contracts. The number needs to be revisited. Laminating it to the 2022 operating model and calling it a standard is how planning errors survive long enough to become cultural ones.
The lever with the clearest evidence remains onboarding infrastructure: proven messaging in reps' hands before they go live, real account context built into the ramp program, and structured practice spaced across the ramp period rather than compressed into orientation week. Organizations that build this see ramps that are more predictable. Predictable ramps are what make a capacity plan reliable, which is ultimately the only thing a capacity plan is for.