Sales Efficiency Metrics for Revenue Operations Teams
Win rates are falling, cycles are stretching, and RevOps needs to measure differently to stay ahead.

Win rates are falling. Sales cycles are stretching. Quota attainment is sliding, and all three are happening at once, which should worry you more than any single number would on its own, because the pipeline math that worked three years ago doesn't hold up anymore. Plug last year's assumptions into this year's model and you get an answer that looks plausible and is quietly wrong, the kind of wrong that doesn't show up until a board meeting in Q3.
The Ebsta x Pavilion 2025 GTM Benchmarks, a dataset covering 655,000 opportunities and $48 billion in pipeline, put average win rates at 19%, down from 21% the year before. Two points doesn't sound like much until you remember this is a whole market moving in the same direction at the same time. One team having a bad quarter is a footnote, but a whole market compressing at once is a different kind of story, and it's the story this piece is trying to untangle, one metric at a time.
Reps spend around 30% of their time actually selling. The rest gets eaten by admin work, internal meetings, and whatever CRM field somebody decided needed to be mandatory this quarter, so the losses start well before a dollar goes toward generating pipeline in the first place. That's before you factor in a buying environment that's gone mostly digital: by 2025, something like 80% of B2B sales interactions between buyers and suppliers were projected to happen through digital channels instead of face to face. Nobody planned for this exact mix; it just sort of accumulated.
Companies with a dedicated RevOps function see 71% higher stock performance than those without one. Sit with that number for a second, because it's not a soft claim about "alignment," it's the market pricing the difference between running sales, marketing, and customer success as one system versus three fiefdoms that don't return each other's Slack messages. When conditions tighten, what you choose to measure stops being a matter of taste, and tracking the wrong things means optimizing for a market that quietly stopped existing six months ago, which is its own special kind of expensive.
Win rate as the first signal of pipeline health
Win rate is the share of qualified opportunities that turn into paying customers, simple to calculate, and just as easy to get wrong if you stop at the headline number.
That 19% figure from Ebsta x Pavilion is a baseline, but it's blended across a huge range of company types, and blending hides more than it reveals. Enterprise teams typically run 20 to 25%, mid-market SaaS sits around 25 to 30%, and SMB-focused teams often land in the 30 to 40% range. Report only the blended average and you have no idea which segment is healthy and which one is dragging the whole thing down.
Here's a fact that surprises people the first time they hear it: a win rate above 40% isn't automatically good news. It can mean the team is under-qualifying deals, or ducking the harder, higher-value opportunities in favor of easy closes that pad the stat sheet. Most healthy B2B teams live in the low-to-mid thirties range, and climbing consistently past that means it's worth asking out loud in a pipeline review: is this team winning hard deals, or avoiding them?
Speed changes the picture too. Opportunities that close within 50 days carry a 47% win rate, while stretching past 50 days drops that number to 20% or lower. Win rate and deal velocity look like two separate gauges on a dashboard, but pull back the housing and they're wired to the same engine.
Relationships matter more than most reps like to admit, and Champify's 2025 Impact Report backs that up bluntly: selling to known contacts delivers a 37% win rate versus 19% for cold outreach, nearly double, just from relationship capital already sitting in the bank. So the practical move is tracking win rate by segment, by rep cohort, by deal source. The single blended number reads like a vanity metric, while the breakdown underneath is where the actual signal lives.
How sales cycle length compounds every other efficiency problem
Average B2B SaaS sales cycle length sits around 84 days. That average hides a lot: SMB deals might close in 30 to 90 days, mid-market runs 60 to 120, enterprise regularly stretches to 6 to 9 months or longer. Averaging across all of that tells you almost nothing about your own pipeline.
Cycles are getting longer, not shorter. Digital Bloom's 2025 data shows cycle length up 22% since 2022, meaning pipeline funded today takes longer to turn into revenue than most forecast models assume. It's a quiet problem, the kind that doesn't announce itself until the quarter you needed it not to be a problem, especially if your model still runs on 2022 math.
Buying committees have grown too, from an average of 5.4 stakeholders previously to 6.8 more recently. More people in the room means more approvals, more calendars to line up, more chances a deal stalls because one VP took a two-week vacation at exactly the wrong time. Ebsta x Pavilion's 2025 data found that getting a decision-maker involved early boosts win rates by 55%. Cycle management runs on stakeholder dynamics as much as raw speed, maybe more.
Forrester's research on B2B buying groups backs this from a different angle: multi-threaded deals (three or more engaged contacts) close 30% faster than single-threaded ones. That's a structural fact about how deal teams get built, and it predicts the shape of the timeline before the deal even starts moving.
For RevOps, cycle length cuts two ways. It's an output you measure after the fact, and an input that wrecks everything downstream from it. Cycles lengthen, and CAC rises, since reps and marketing spend longer keeping a deal warm. Pipeline coverage assumptions break, since dollars sitting in pipeline take longer to convert into bookings, and quota math falls apart right alongside them, since a rep's quarter was built assuming a cycle length that no longer holds true. Most B2B teams find their sweet spot somewhere around 46 to 75 days, the zone where speed and deal quality still manage to coexist without one wrecking the other.
Pipeline velocity as the metric that ties acquisition inputs together
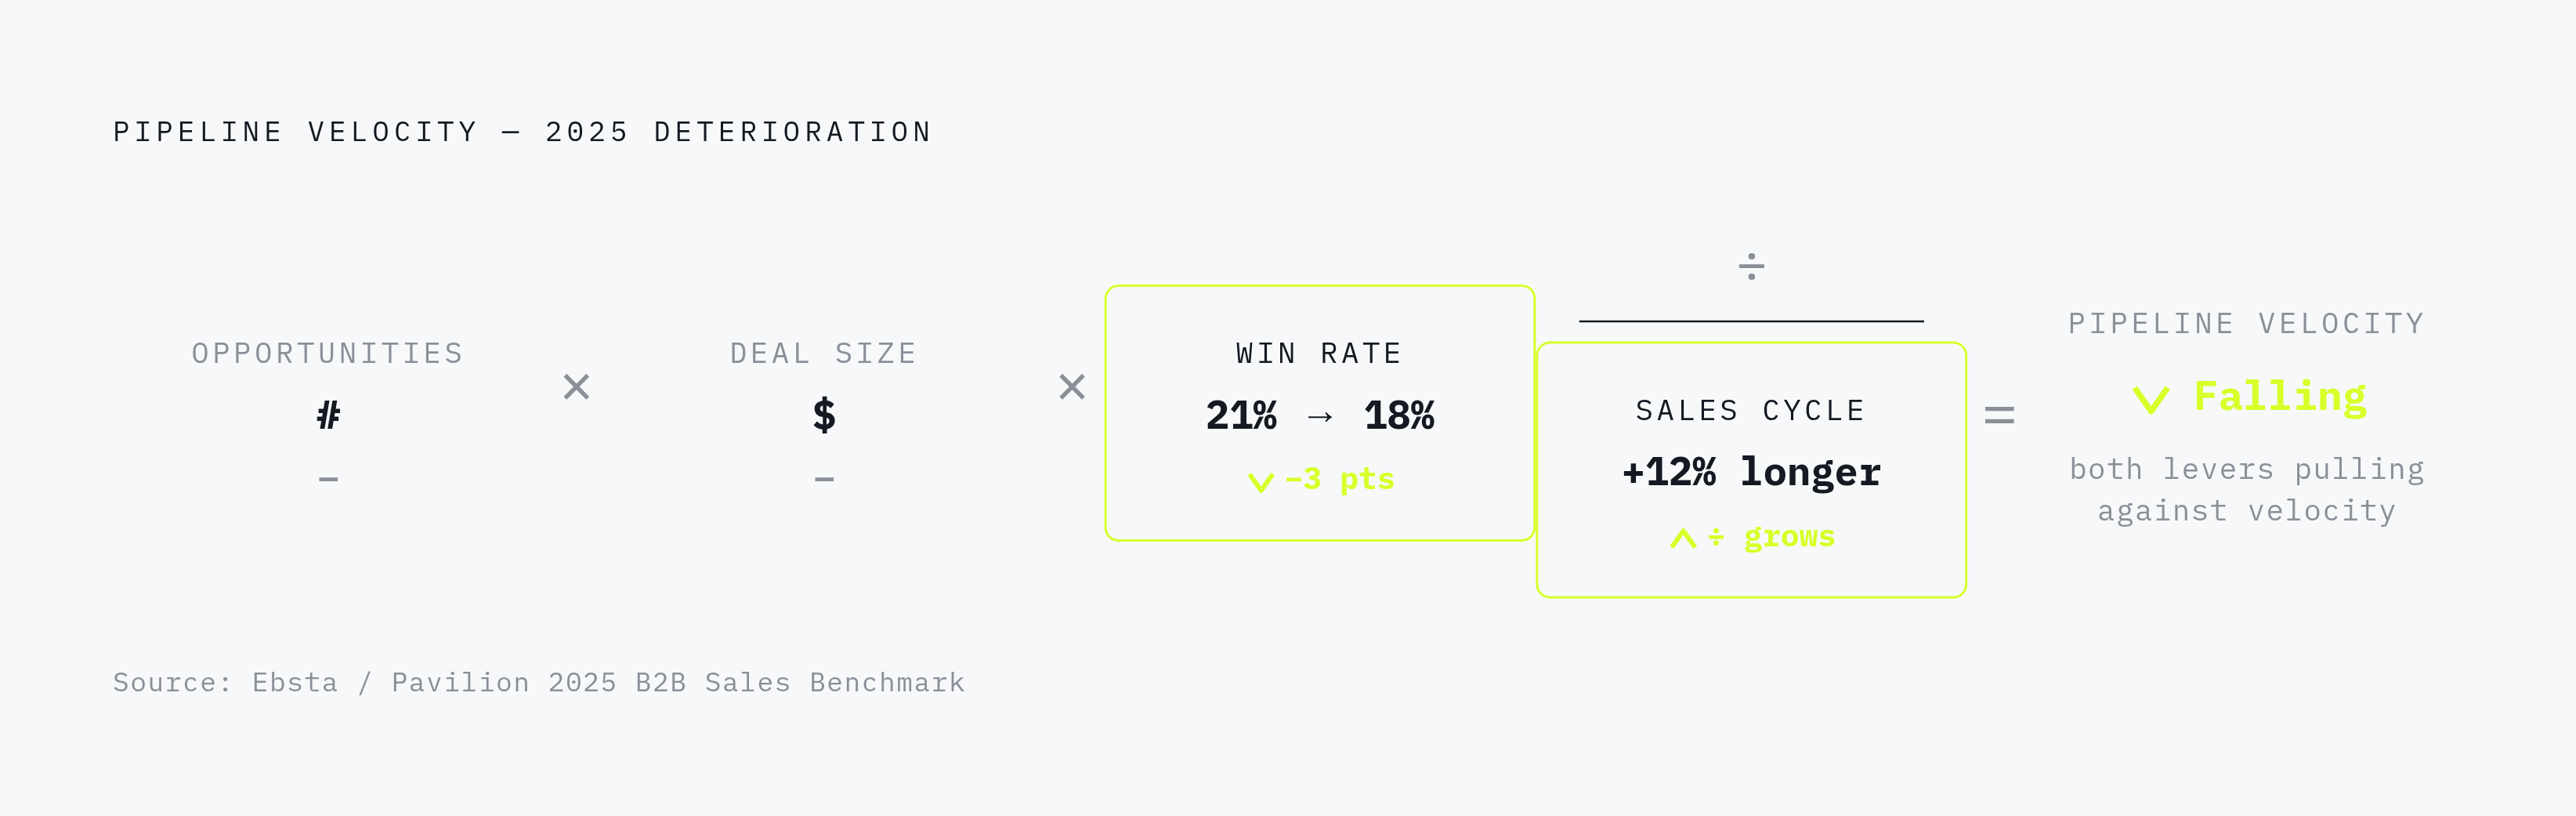
Pipeline velocity has a clean formula: opportunities times deal size times win rate, divided by sales cycle length. One number, and it tells you how efficiently pipeline turns into actual revenue over time.
Its real use shows up in the diagnostic, not the formula. Falling velocity alongside climbing pipeline volume is a warning light, and it's a familiar pattern if you've sat through enough pipeline reviews: a team misses a quarter, panics, and responds by cranking out more pipeline indiscriminately. It looks productive on a dashboard, but it fixes nothing.
The 2025 Ebsta/Pavilion benchmark shows both halves of the equation moving the wrong way at once: cycles lengthened 12% year over year while win rates dropped from 21% to 18%. Two variables inside the same formula, working against the number at the same time. That's a system under real strain, not a run of bad luck you can wait out with a strong Q4.
The top-quartile response tends to run counter to instinct: fewer, better-qualified opportunities, with higher win rates and bigger deal sizes. Quality as a velocity strategy beats volume as a coping mechanism for a bad quarter, basically every time. RevOps teams calibrate velocity against actual conversion behavior, not some aspirational coverage number somebody scrawled on a whiteboard during annual planning, setting pipeline targets off what the funnel actually does rather than what everyone hopes it will do.
Pipeline coverage ratio and why raw volume overstates true readiness
Coverage ratio is total pipeline value divided by revenue target. In theory it tells you how many dollars of pipeline exist for every dollar of quota you're carrying.
Standard benchmarks vary by segment: enterprise runs 3 to 5x, mid-market 2.5 to 4x, high-velocity SMB teams 2 to 3x. But the right number for your team depends on your own historical win rate, not an industry rule of thumb pulled from someone else's slide deck. With market-wide win rates sitting around 19%, a 3x coverage ratio means the team has to close a disproportionate chunk of what's in the pipe just to hit plan. At that win rate, 4 to 5x starts looking like the practical floor, not a stretch goal.
Here's the catch that most planning decks skip entirely: the 2025 Fullcast Benchmarks Report found that high-ICP accounts make up only 23% of total pipeline for most teams. Raw pipeline volume tends to exaggerate how ready you actually are. A pipeline that looks like 4x coverage on paper might be a lot thinner once you strip out the leads that were never a great fit to begin with.
Calculating coverage on ICP-weighted pipeline, rather than total pipeline, is the fix. Otherwise the metric hands you false confidence walking into a quarter, and confident is worse than uncertain when the confidence is wrong; uncertainty at least makes people ask questions before they commit numbers to a board deck. This is exactly where RevOps' cross-functional view earns its keep, catching marketing sourcing low-ICP leads that inflate a pipeline number sales and finance then use to make real commitments.
Quota attainment as a system-level diagnostic, not just a rep performance number
Quota attainment benchmarks swing wildly depending on who's measuring and how. RepVue's Q2 2025 Cloud Sales Index found average attainment of 42.69%. That means 57.31% of reps missed their number that quarter, and more than half the reps in that dataset came up short, which is a strange kind of average when the majority falls below it.
Part of the spread across research sources comes down to definitions: individual attainment versus team attainment, cloud-only companies versus all of B2B. Pick one definition and stick with it, because comparing attainment across mismatched definitions produces bad conclusions dressed up as data.
The longer trend is the uncomfortable part. A decade ago, most reps hit quota in a given year, but recent data puts several segments well below that, some reporting fewer than half of reps making plan. Best-in-class teams now treat 60%+ attainment as the target, and here's the twist worth sitting with: go meaningfully above that, and it's fair to ask whether the quota was simply set too low from the start.
Attainment is more fixable than it looks, though. Research consistently points toward coaching quality as a lever for improving quota attainment, suggesting an enablement fix well before headcount or territory redesign.
The RevOps framing matters here, because when attainment falls, the number itself doesn't say why. Is it pipeline quality, meaning coverage ratio and ICP fit? Cycle length dragging deals past the quarter close? Rep capacity, meaning headcount or ramp time? Or is the quota itself built on assumptions that stopped matching reality two quarters back? Quota attainment flags that something's wrong, and the system view is what actually explains it.
Customer acquisition cost and the payback period that determines scalability
CAC is the total sales and marketing spend it takes to land one new customer. It's the denominator RevOps is ultimately solving for, and it swings enormously by motion: SMB deals carry much lower acquisition costs than enterprise, where longer cycles, bigger sales teams, and messier procurement all pile on cost before a contract ever gets signed.
CAC payback period, the number of months needed to recover that cost out of gross margin, is the version that matters day to day. A long payback period means growth is burning cash faster than the business can replace it, which strains the balance sheet even while the top-line revenue chart looks like it's climbing just fine.
CAC payback periods vary widely across B2B SaaS companies, and a long payback period is a genuine strain — especially for any customer who churns before the business ever recoups what it spent to acquire them.
There's a ratio version too: gross sales efficiency, new ARR divided by total sales and marketing spend. Above 0.75 signals efficient revenue generation, between 0.5 and 0.75 is worth watching closely, and below 0.5 calls for a real intervention. Rising acquisition costs, driven by longer cycles, bigger buying committees, and tougher competition, make payback period extension one of the most common efficiency problems RevOps teams are wrestling with heading into 2025 and 2026.
Net revenue retention as the metric that reveals whether growth is real
NRR measures how much revenue the existing customer base generates after churn, contraction, and expansion all get netted out. A company can hit every new-logo target on the board and still be shrinking underneath, if NRR is weak enough to offset the wins. It's the metric that most exposes whether growth is real or just erosion happening slowly, one renewal at a time, dressed up in a board deck as momentum.
NRR might be the defining RevOps metric precisely because no single department owns it. Customer success touches it, product touches it, finance reports on it, and sales shapes it indirectly through who gets sold to in the first place. That's the whole reason RevOps exists as a function: to own the thing that falls into the crack between departments.
NRR above 100% means the existing base grows on its own, without a single new logo added. That's a compounding advantage, and it changes the underlying economics of growth in a way new-logo acquisition by itself never quite manages, no matter how sharp your sales team is at closing.
There's a real relationship between NRR and CAC payback, too. High NRR extends customer lifetime value, and a longer lifetime value retroactively makes every dollar spent on acquisition look smarter than it did at the time you spent it, since the two metrics run on the same track. Best-in-class SaaS companies keep NRR comfortably above 100%, especially in enterprise, where upsell and cross-sell revenue can outpace new-logo revenue entirely. Chase new logos without watching NRR and you're solving half the equation while presenting it as the whole answer.
Building a metric stack that spans the full lifecycle without becoming unmanageable
One or two KPIs per funnel stage gives the clearest overview. That's the practitioner rule of thumb, and it holds up because more metrics rarely mean more clarity; usually they just add noise to a dashboard nobody reads closely past the first week it's built. Overview metrics tell you where to look, while diagnostic metrics underneath tell you what's actually broken.
A workable stack moves in sequence: pipeline health first, meaning coverage ratio and velocity, then acquisition efficiency, meaning win rate, CAC, and cycle length, then team output, meaning quota attainment, then retention and expansion, meaning NRR. Each stage feeds the next, and that's how the metrics actually behave out in the field: one number sets up the conditions for the next one to move.
The common failure mode is tracking too much at the top level. Teams chase whichever number is easiest to move that week instead of the one that actually reflects revenue health, and nobody owns the whole stack alone, either. Marketing owns the inputs feeding CAC, sales owns win rate and cycle length, customer success owns NRR, finance owns payback period. RevOps is the function built to stitch those pieces into one coherent view, replacing the four spreadsheets that quietly disagree with each other every Monday morning.
Tooling matters here too, though less than people assume. Closing the gap between tracking a number and fixing it comes down to having the right context at the right stage, more than to any generic dashboard people glance at once and ignore. Tracking pipeline velocity across segments takes consistent data collection and real visibility into deal progression at every stage. It's grinding, unglamorous work, the kind Letterstory handles so nobody's stuck updating a spreadsheet every Friday wondering where the quarter went. The same principle, one connected view instead of scattered reports, applies as much to how marketing and sales coordinate around content and engagement as it does to raw pipeline math.
The real test of a metric stack isn't how many numbers sit on the dashboard. It's whether every number, when it moves, produces a change you can explain and act on, the kind that belongs on the screen the team stares at every morning rather than buried in a monthly report nobody opens.